> ## Documentation Index
> Fetch the complete documentation index at: https://docs.isotopes.ai/llms.txt
> Use this file to discover all available pages before exploring further.
# Notebooks
In aidnn, every analysis you run is saved as a **Notebook**, a record of your prompt, the reasoning behind it, the steps taken and the results produced. Creating your first notebook takes only a few clicks. This guide walks you through each part of the screen
## Starting from the Home Screen
The **Home screen** is where every new analysis begins. You can return to it at any time by clicking the **Home** icon or the aidnn logo in the top-left corner.
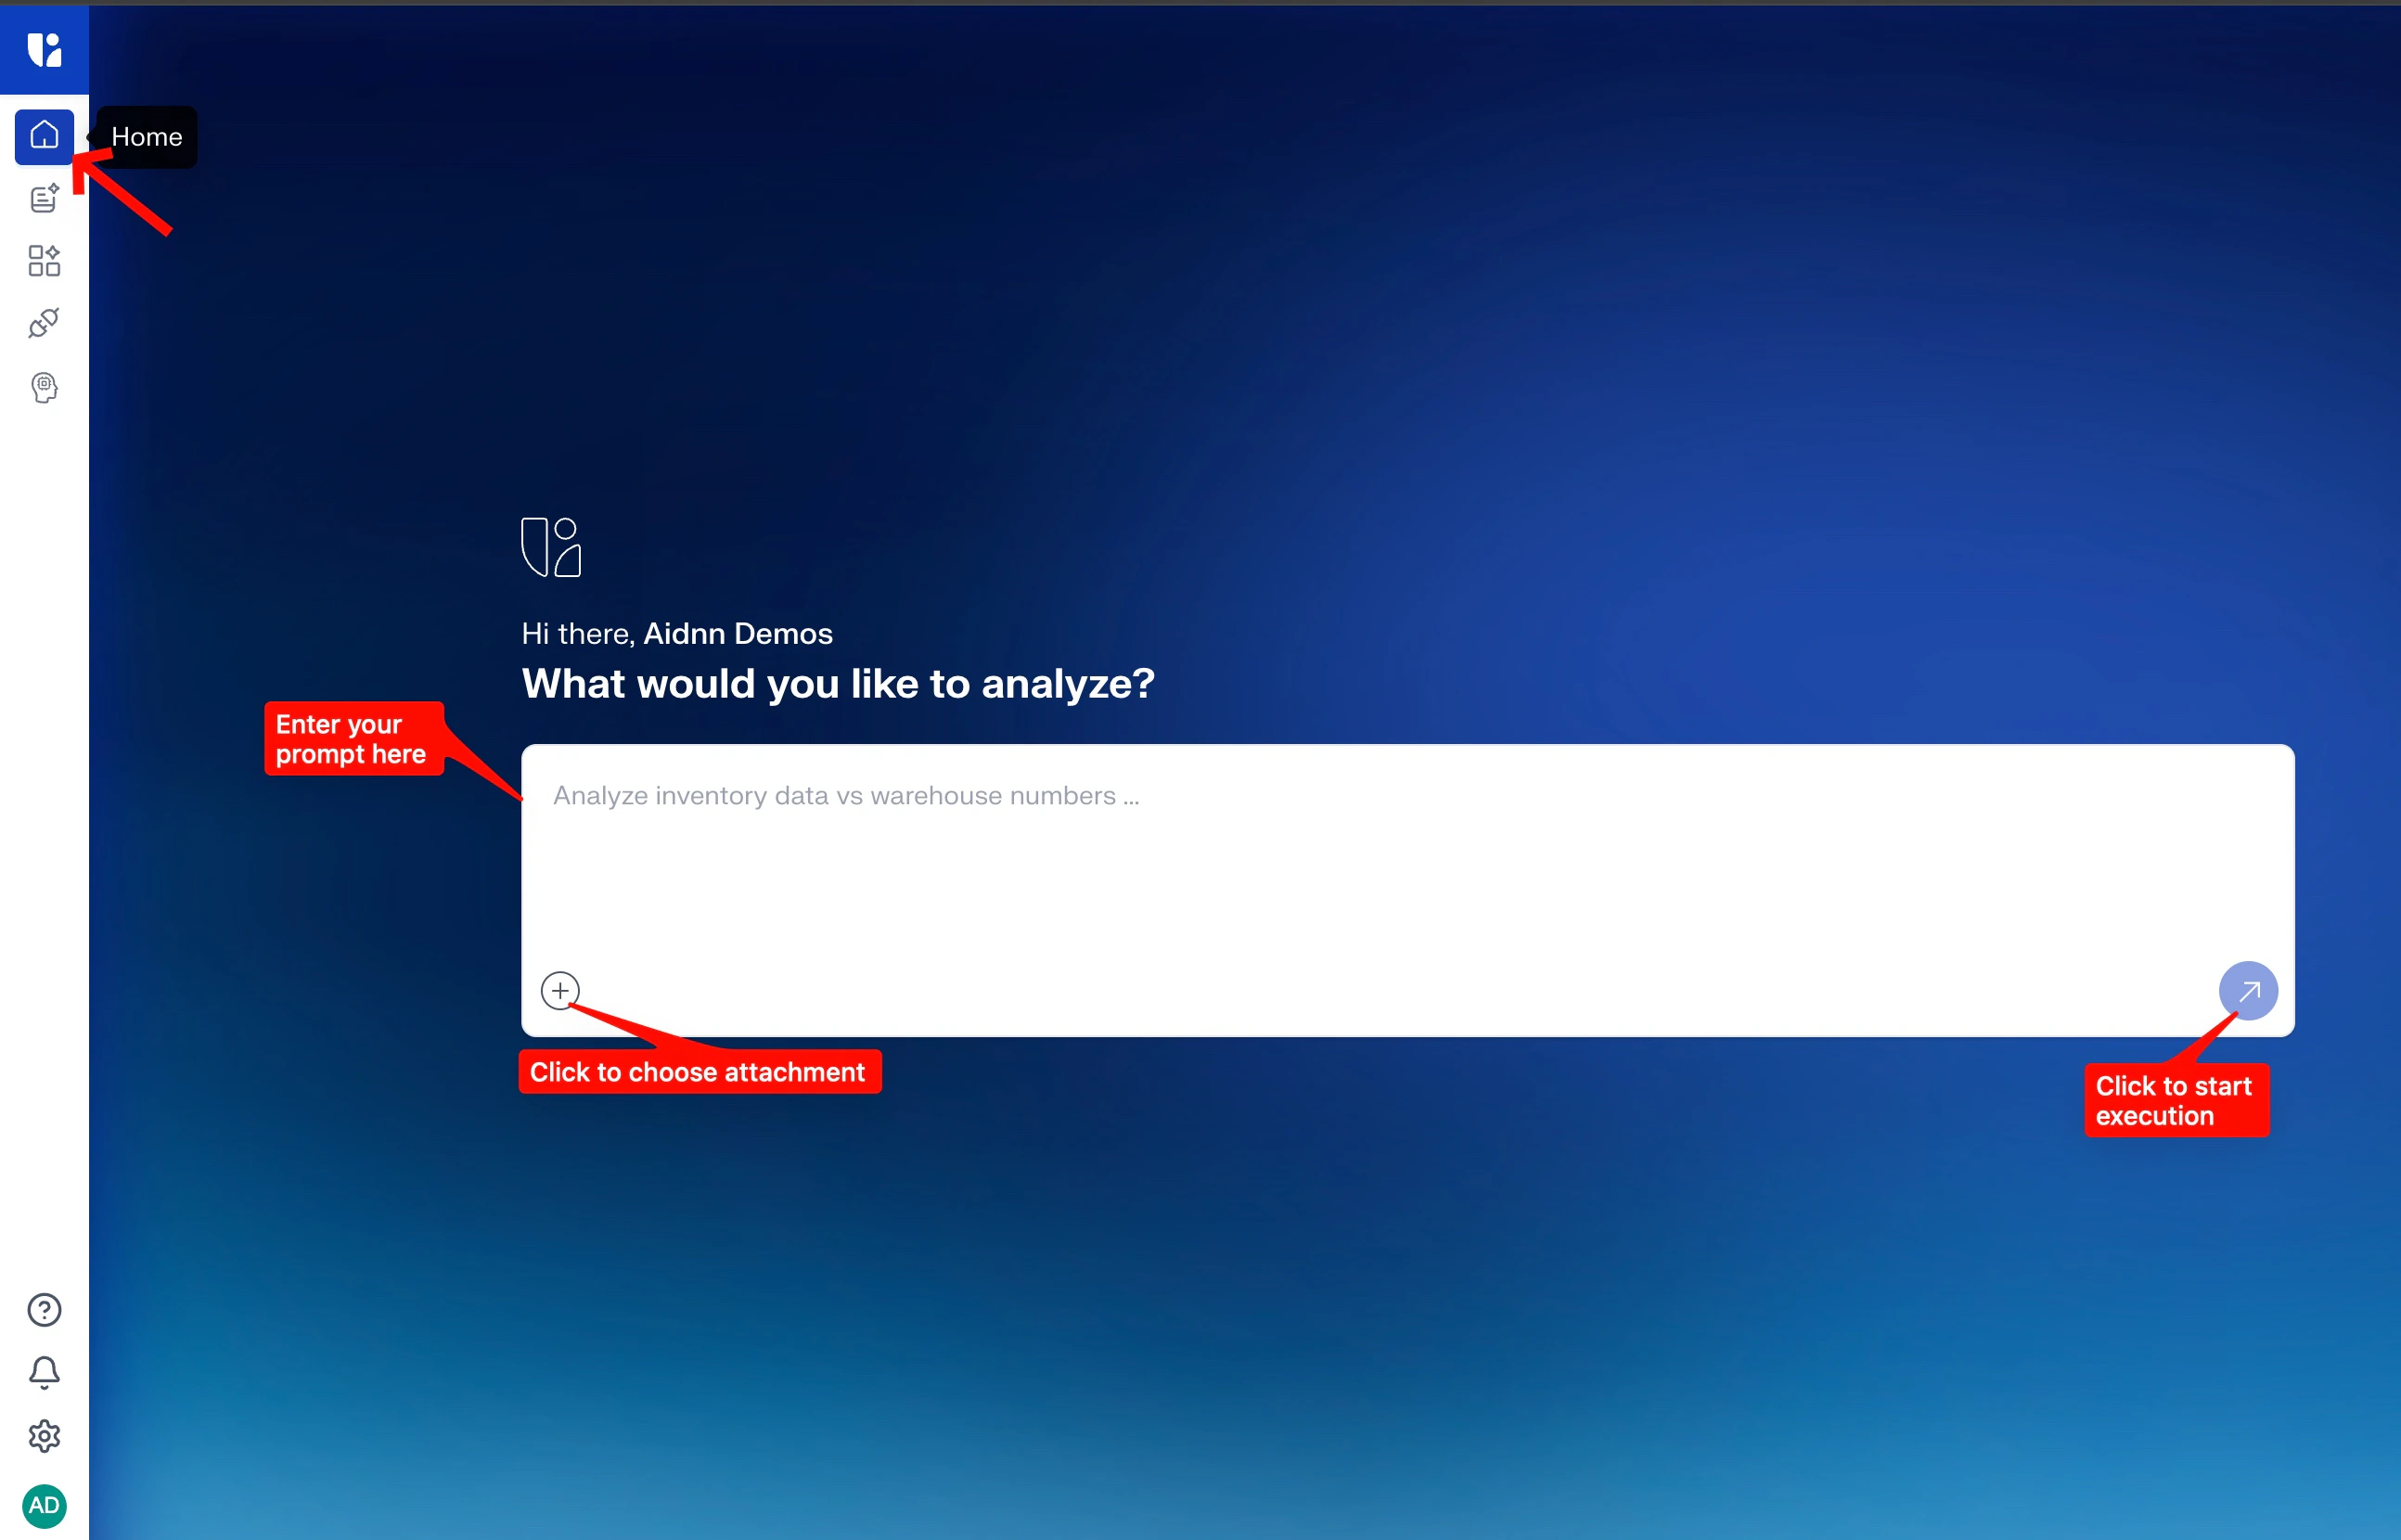 The Home screen has three things you need to know:
* **Prompt box** — type your question or analysis request in plain English. This becomes the starting point of your notebook.
* **Attachment (+) icon** — upload CSV, Excel, or PDF files, or bring in data from Google Drive or a connector. aidnn uses these files as inputs for your analysis.
* **Start execution arrow** — the blue arrow on the right of the prompt box. Click it to launch your analysis.\\
## Uploading Your Data
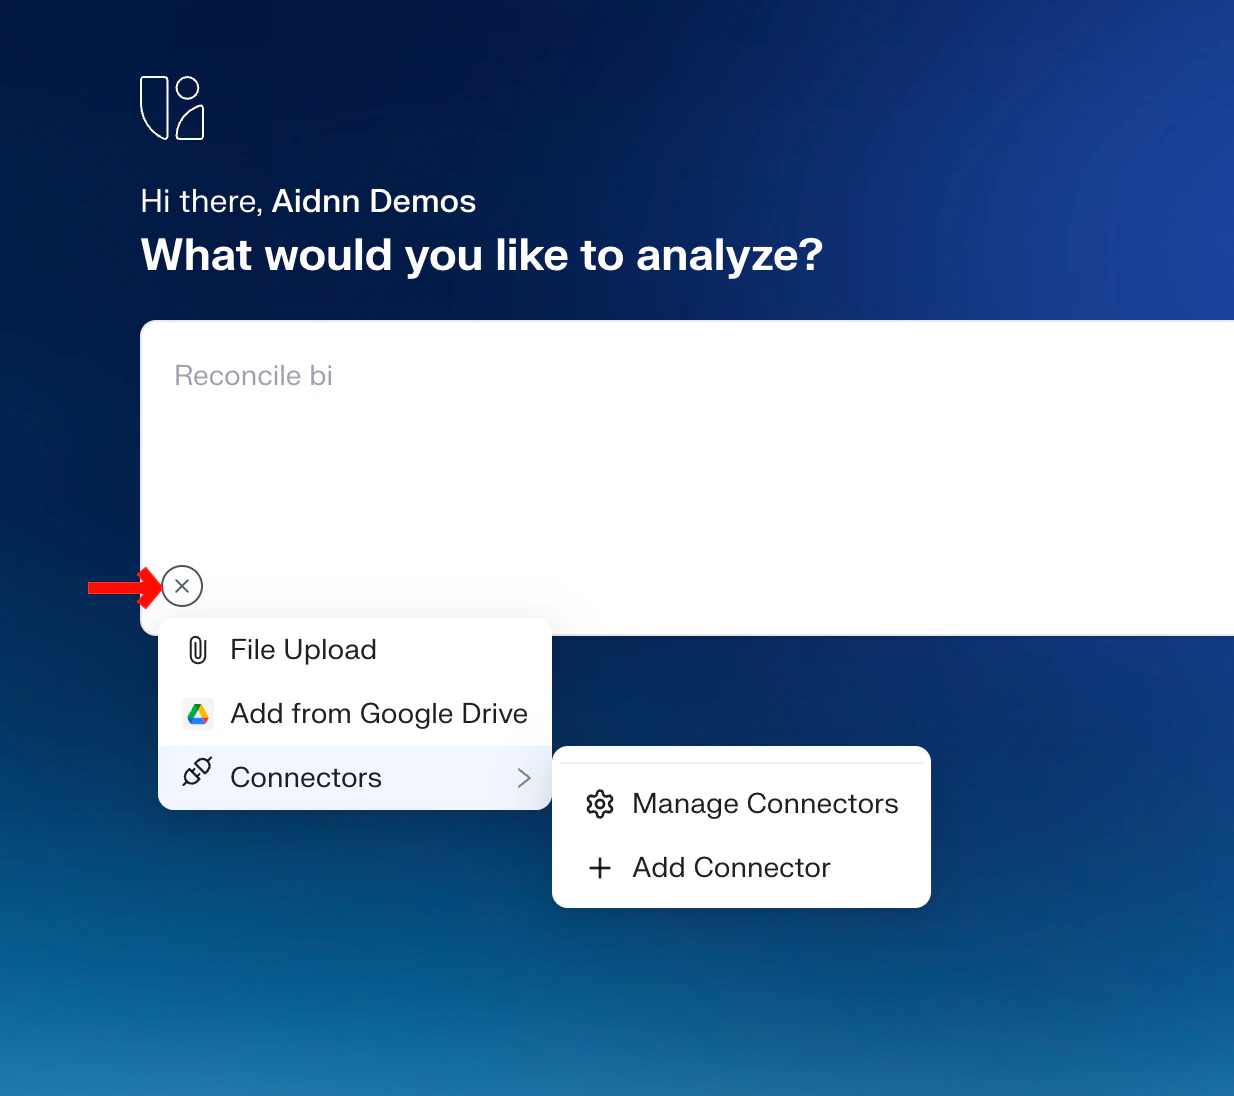
Click the **+** icon under the prompt box to open the attachment menu. You have three options:
* **File Upload** — upload files directly from your computer (CSV, Excel, PDF).
* **Add from Google Drive** — pick files from a connected Google Drive account.
* **Connectors** — pull data from connected systems such as Snowflake, BigQuery, or QuickBooks. Use **Manage Connectors** to review existing connections, or **+ Add Connector** to set up a new one.
The Home screen has three things you need to know:
* **Prompt box** — type your question or analysis request in plain English. This becomes the starting point of your notebook.
* **Attachment (+) icon** — upload CSV, Excel, or PDF files, or bring in data from Google Drive or a connector. aidnn uses these files as inputs for your analysis.
* **Start execution arrow** — the blue arrow on the right of the prompt box. Click it to launch your analysis.\\
## Uploading Your Data
Click the **+** icon under the prompt box to open the attachment menu. You have three options:
* **File Upload** — upload files directly from your computer (CSV, Excel, PDF).
* **Add from Google Drive** — pick files from a connected Google Drive account.
* **Connectors** — pull data from connected systems such as Snowflake, BigQuery, or QuickBooks. Use **Manage Connectors** to review existing connections, or **+ Add Connector** to set up a new one.
 ## Choosing How aidnn Runs Your Analysis
By default, aidnn runs in **analysis mode** it drafts a plan, lets you review or edit it, and only then executes. If you want different behavior, type `/` in the prompt box to open the commands menu.
## Choosing How aidnn Runs Your Analysis
By default, aidnn runs in **analysis mode** it drafts a plan, lets you review or edit it, and only then executes. If you want different behavior, type `/` in the prompt box to open the commands menu.
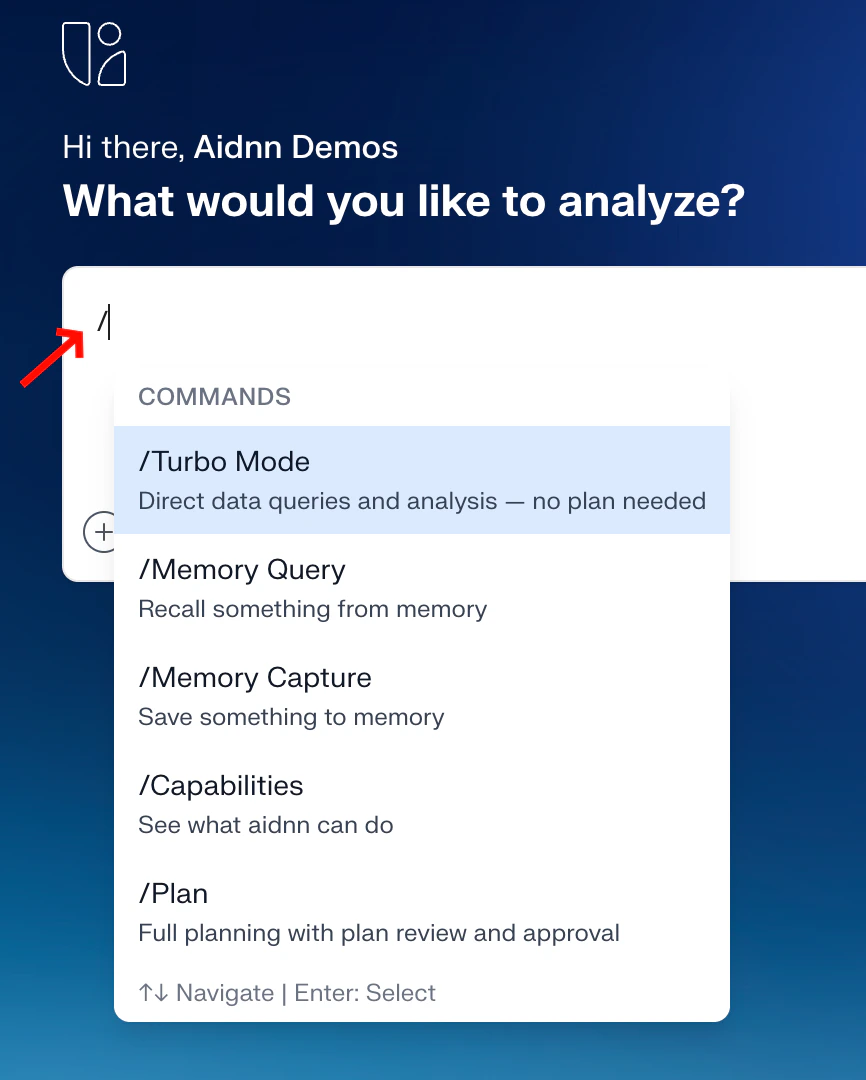 The available commands are:
* **/Turbo Mode** — skips the planning phase and goes straight to direct query execution and results. Best for quick, well-defined questions.
* **/Plan** — full planning with plan review and approval. This is the default analysis mode.
* **/Memory Query** — recall something aidnn has stored in memory.
* **/Memory Capture** — save context, preferences, or facts to memory for future analyses.
* **/Capabilities** — see what aidnn can do.
If you do not pick a command, aidnn uses the standard analysis flow:
> Plan → (optional) Plan Edit → Plan Approval → Execution → Results
## Starting the Analysis
When your prompt and files are ready, click the **blue arrow** on the right side of the prompt box. aidnn begins processing your request, moves you to the **Analysis View**, and your first notebook is created automatically. Every notebook is saved, so you can return to it, modify it, or build on it later.\
\
Understanding the Analysis View
The **Analysis View** shows the full lifecycle of your analysis. The left panel lists each phase; the right shows the corresponding output. Every phase is clickable, so you can jump to any step at any time.
aidnn moves through four phases:
### 1. Thought Process
aidnn interprets your request—working out what you are asking for, which datasets and columns are needed, and how to group, filter, and calculate the metrics. This gives you transparency into **how your prompt is being understood** before anything runs.
### 2. Plan
aidnn generates a **step-by-step plan** covering data loading, cleaning, aggregation, calculations, and chart or table preparation. You can **Approve** the plan, **Edit** it directly, or click **Feedback** to request changes. If you edit or leave feedback, aidnn creates a **re-plan**. Once approved (or auto-executed if **Auto-Execution** is on), aidnn moves to Execution.
### 3. Execution
aidnn carries out every task in the plan—data cleaning, intermediate previews, calculations in sequence, and progress indicators for each step. When it finishes, the left panel shows a green **Completed** indicator.
### 4. Results
aidnn presents your output with **summary statistics** (rows, columns, missing values, date ranges), a **data preview**, key **insights**, and **visualizations** like bar charts, line charts, and histograms.
Every analysis—prompt, thought process, plan, execution, and results—is **automatically saved as a notebook**. Clicking any phase on the left panel takes you straight to that screen, making it easy to retrace how aidnn arrived at its results.\
\
Working with Your Notebook
Once an analysis has finished, the Results page gives you a set of tools to help you organize, extend, explain, and share your notebook. These tools turn a single analysis into a reusable asset for you and your team.
## Add Tag
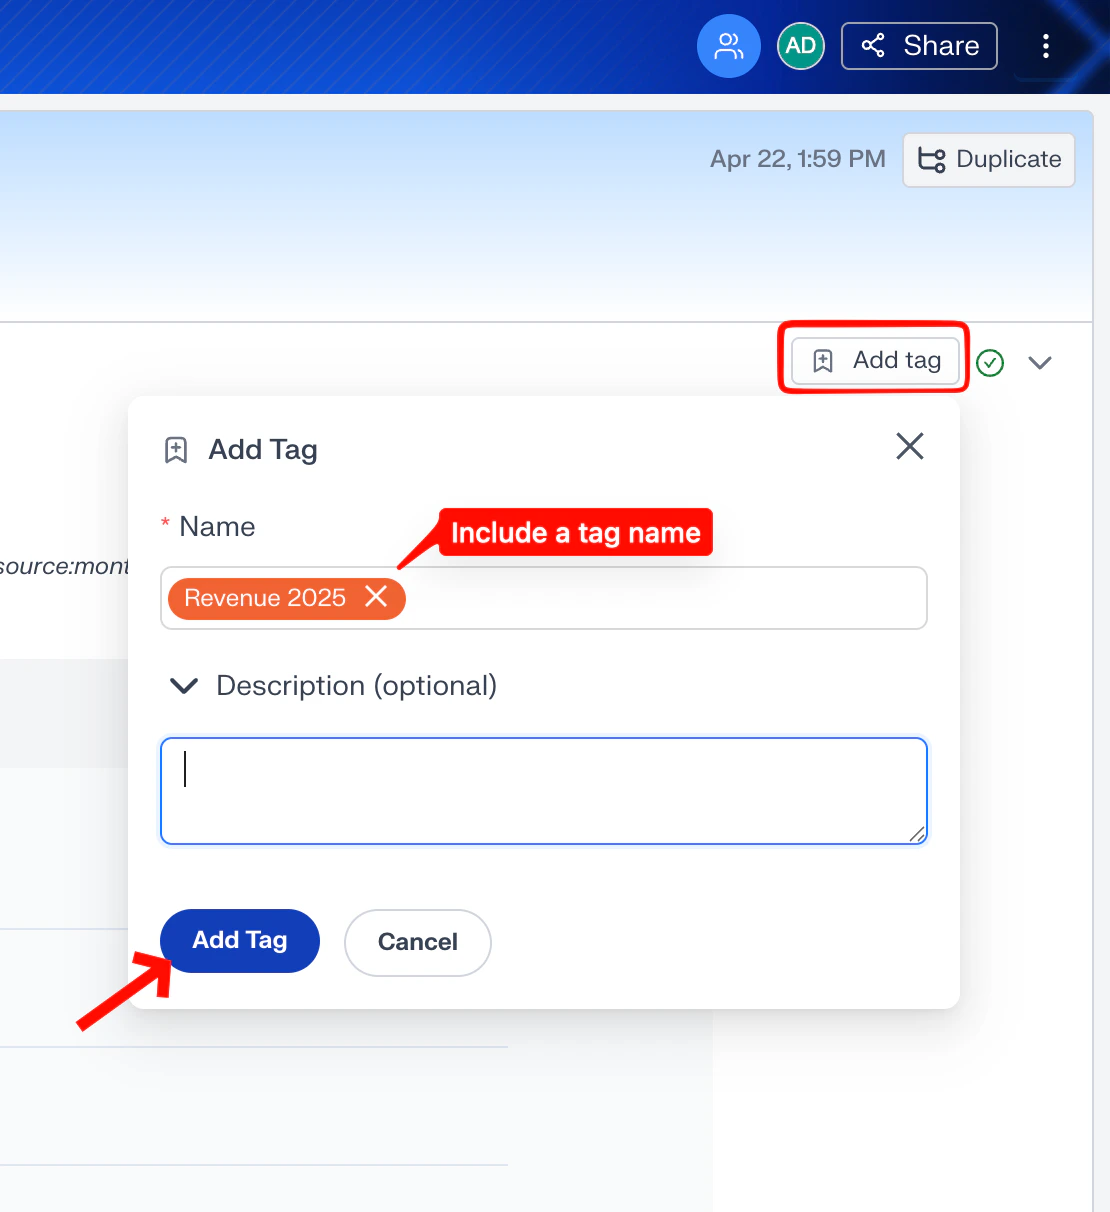
Tags help you group related notebooks together in **Workspaces**. To add a tag, click **Add Tag** on the Results page. You can either pick an existing tag or create a new one by typing it and pressing **Enter**. Each tag needs a name; a description is optional.
The available commands are:
* **/Turbo Mode** — skips the planning phase and goes straight to direct query execution and results. Best for quick, well-defined questions.
* **/Plan** — full planning with plan review and approval. This is the default analysis mode.
* **/Memory Query** — recall something aidnn has stored in memory.
* **/Memory Capture** — save context, preferences, or facts to memory for future analyses.
* **/Capabilities** — see what aidnn can do.
If you do not pick a command, aidnn uses the standard analysis flow:
> Plan → (optional) Plan Edit → Plan Approval → Execution → Results
## Starting the Analysis
When your prompt and files are ready, click the **blue arrow** on the right side of the prompt box. aidnn begins processing your request, moves you to the **Analysis View**, and your first notebook is created automatically. Every notebook is saved, so you can return to it, modify it, or build on it later.\
\
Understanding the Analysis View
The **Analysis View** shows the full lifecycle of your analysis. The left panel lists each phase; the right shows the corresponding output. Every phase is clickable, so you can jump to any step at any time.
aidnn moves through four phases:
### 1. Thought Process
aidnn interprets your request—working out what you are asking for, which datasets and columns are needed, and how to group, filter, and calculate the metrics. This gives you transparency into **how your prompt is being understood** before anything runs.
### 2. Plan
aidnn generates a **step-by-step plan** covering data loading, cleaning, aggregation, calculations, and chart or table preparation. You can **Approve** the plan, **Edit** it directly, or click **Feedback** to request changes. If you edit or leave feedback, aidnn creates a **re-plan**. Once approved (or auto-executed if **Auto-Execution** is on), aidnn moves to Execution.
### 3. Execution
aidnn carries out every task in the plan—data cleaning, intermediate previews, calculations in sequence, and progress indicators for each step. When it finishes, the left panel shows a green **Completed** indicator.
### 4. Results
aidnn presents your output with **summary statistics** (rows, columns, missing values, date ranges), a **data preview**, key **insights**, and **visualizations** like bar charts, line charts, and histograms.
Every analysis—prompt, thought process, plan, execution, and results—is **automatically saved as a notebook**. Clicking any phase on the left panel takes you straight to that screen, making it easy to retrace how aidnn arrived at its results.\
\
Working with Your Notebook
Once an analysis has finished, the Results page gives you a set of tools to help you organize, extend, explain, and share your notebook. These tools turn a single analysis into a reusable asset for you and your team.
## Add Tag
Tags help you group related notebooks together in **Workspaces**. To add a tag, click **Add Tag** on the Results page. You can either pick an existing tag or create a new one by typing it and pressing **Enter**. Each tag needs a name; a description is optional.
 ## Duplicate
You can always ask a follow-up question from the Results page of the most recent analysis in a notebook. Sometimes, though, you want to start a new line of inquiry from an earlier analysis or continue someone else's notebook without changing their work. **Duplicating** lets you do both.
To duplicate a previous analysis:
Click the analysis quad on the left panel that you want to duplicate from.
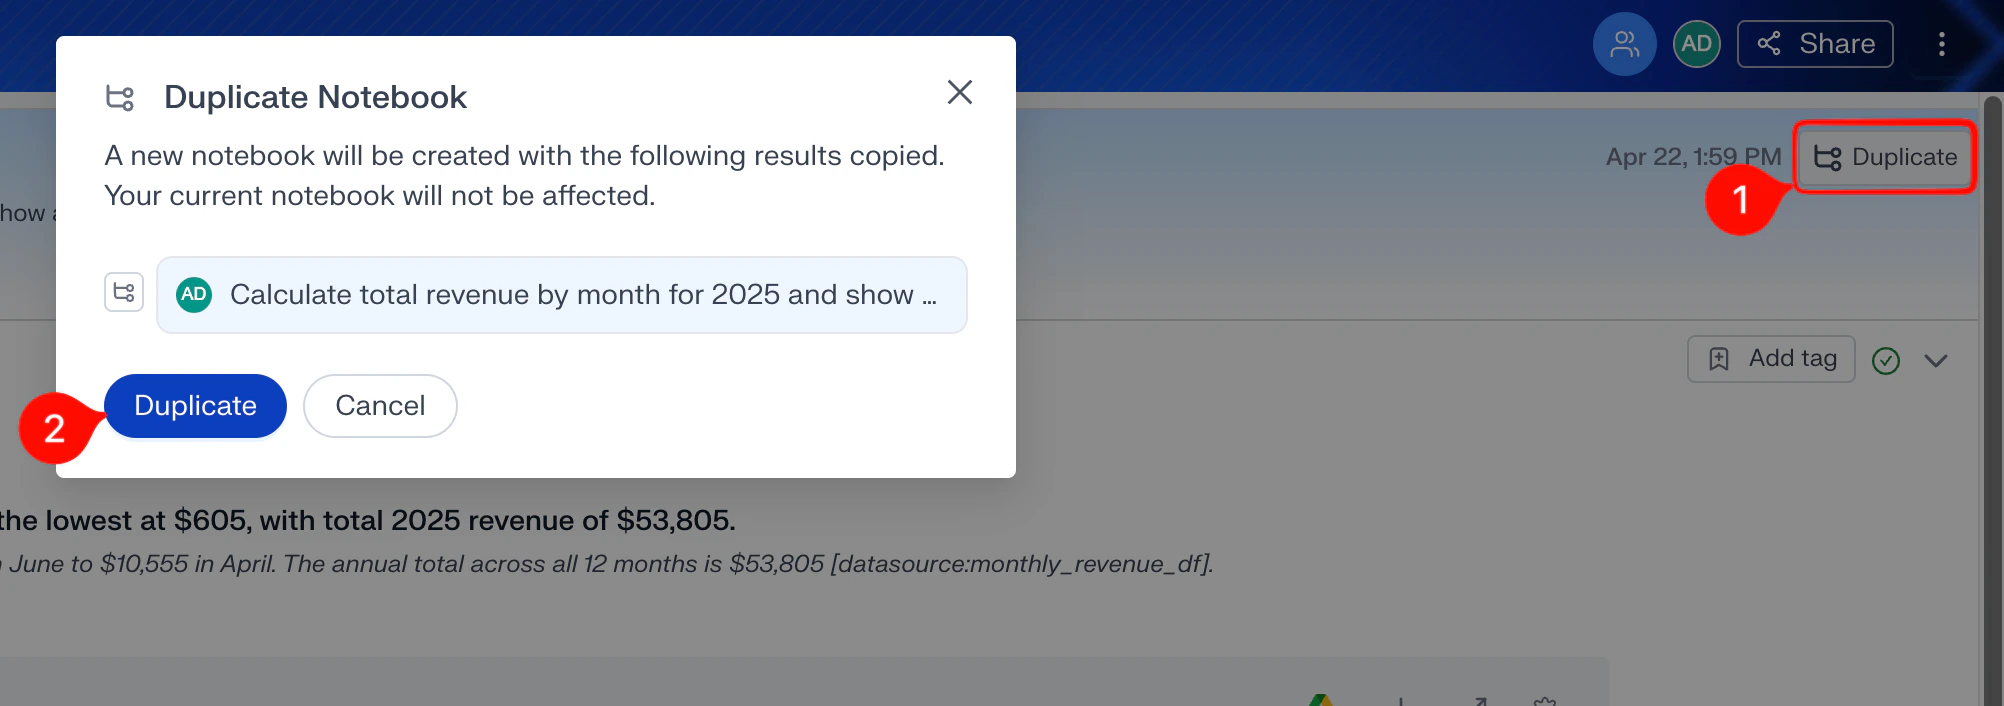
Click the **Duplicate** icon in the top-right corner of the Results page.
A confirmation modal appears, summarizing what will be copied. Review it, then click **Duplicate** to confirm.
aidnn launches a new notebook that keeps every analysis quad up to the one you duplicated from, and adds your new analysis on top.
## Duplicate
You can always ask a follow-up question from the Results page of the most recent analysis in a notebook. Sometimes, though, you want to start a new line of inquiry from an earlier analysis or continue someone else's notebook without changing their work. **Duplicating** lets you do both.
To duplicate a previous analysis:
Click the analysis quad on the left panel that you want to duplicate from.
Click the **Duplicate** icon in the top-right corner of the Results page.
A confirmation modal appears, summarizing what will be copied. Review it, then click **Duplicate** to confirm.
aidnn launches a new notebook that keeps every analysis quad up to the one you duplicated from, and adds your new analysis on top.
 The original notebook is never changed. Duplicating gives you a safe way to explore variations or create your own version of a shared analysis.
## Explain, Ask aidnn, and Verify
Anyone reading an analysis can ask aidnn to explain, clarify, or verify any part of it. Highlight any text in any section of the analysis to open the tooltip menu shown below.
The original notebook is never changed. Duplicating gives you a safe way to explore variations or create your own version of a shared analysis.
## Explain, Ask aidnn, and Verify
Anyone reading an analysis can ask aidnn to explain, clarify, or verify any part of it. Highlight any text in any section of the analysis to open the tooltip menu shown below.
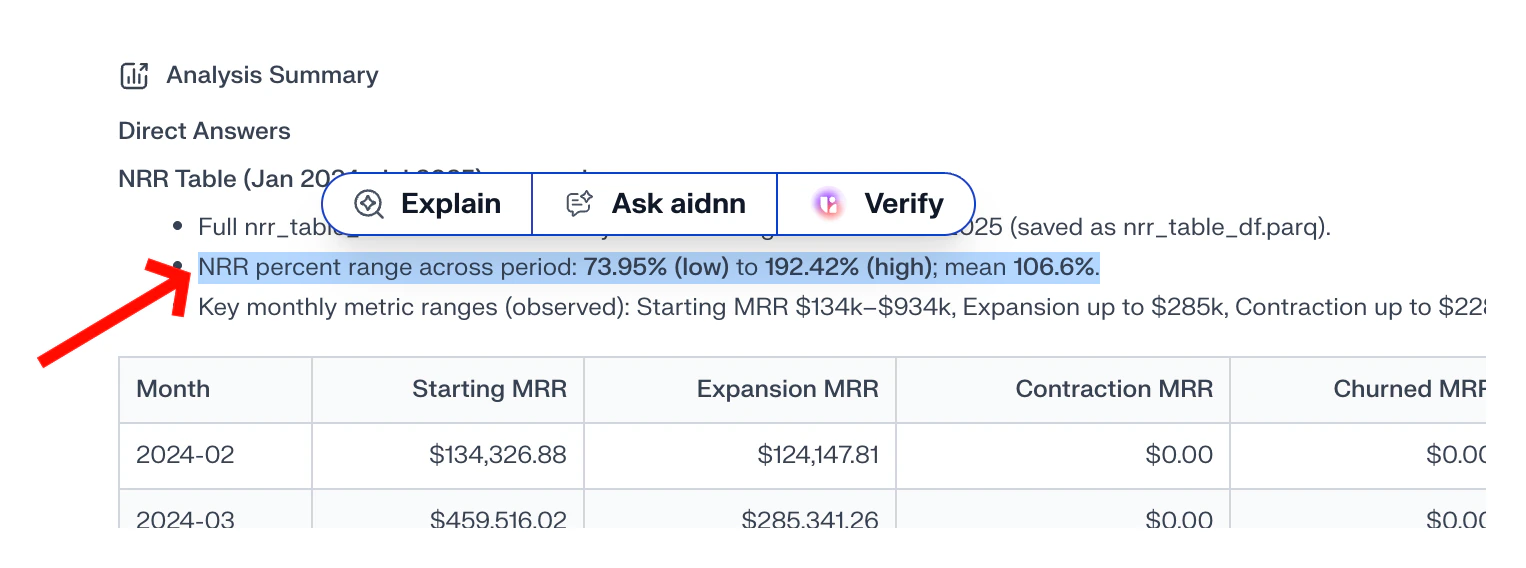 * **Explain** — opens a side window with an explanation of the highlighted text.
* **Ask aidnn** — lets you ask a specific question about the highlighted text. aidnn answers your question instead of giving a general explanation.
* **Verify** — re-checks the underlying calculation or claim so you can confirm the number is correct.
Use these tools to understand:
* how a number was calculated
* why a spike or dip occurred
* which factors contributed to a result
They are especially useful when sharing analyses with stakeholders, and when you return to your own notebook after some time and need a refresher on the reasoning.
## Sharing Your Notebook
aidnn makes collaboration as easy as sharing a Google Doc. You can share a notebook so others can view, review, or continue the analysis.
* **Explain** — opens a side window with an explanation of the highlighted text.
* **Ask aidnn** — lets you ask a specific question about the highlighted text. aidnn answers your question instead of giving a general explanation.
* **Verify** — re-checks the underlying calculation or claim so you can confirm the number is correct.
Use these tools to understand:
* how a number was calculated
* why a spike or dip occurred
* which factors contributed to a result
They are especially useful when sharing analyses with stakeholders, and when you return to your own notebook after some time and need a refresher on the reasoning.
## Sharing Your Notebook
aidnn makes collaboration as easy as sharing a Google Doc. You can share a notebook so others can view, review, or continue the analysis.
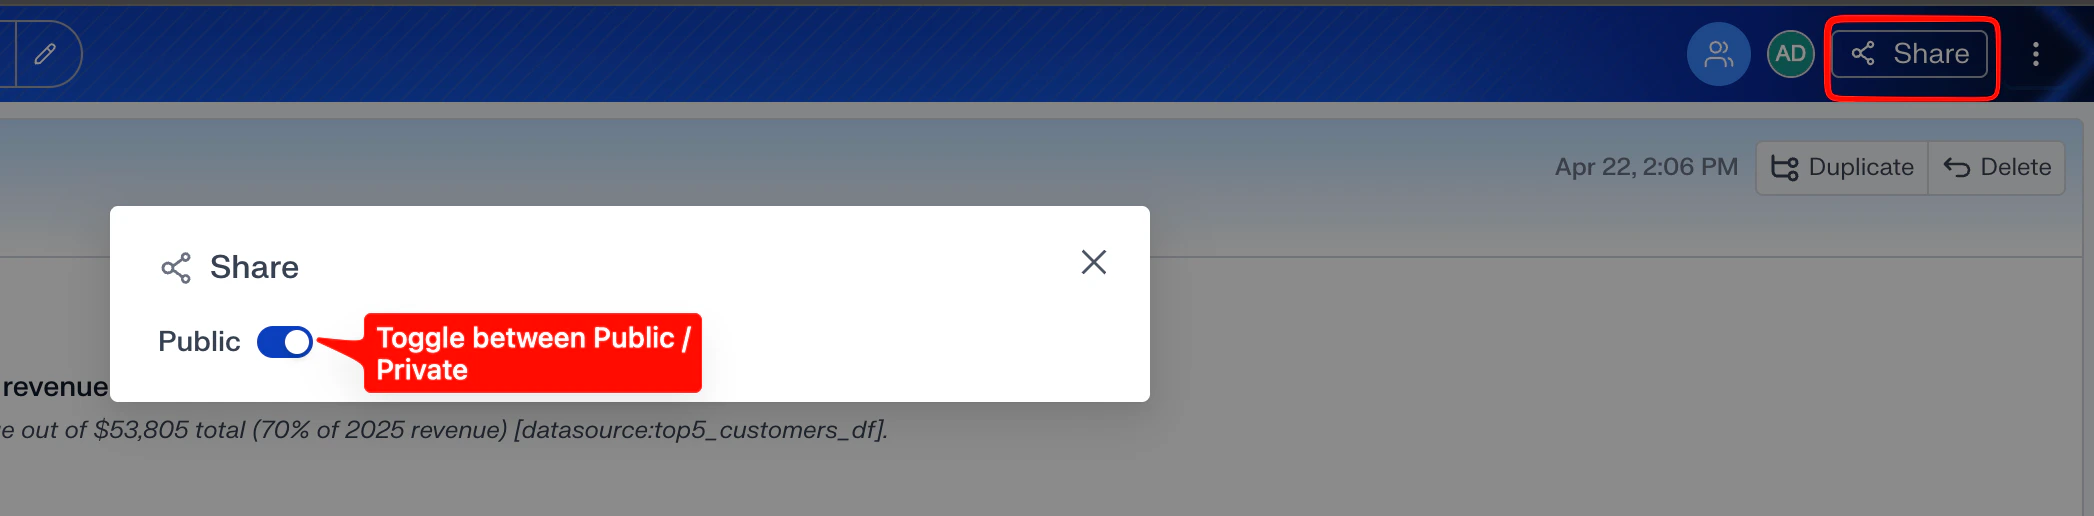 To share your notebook:
Click the **Share** button in the top-right corner of the notebook.
In the Share dialog, choose who can access it:
* **Specific people** — share with individuals in the same aidnn account as you.
* **Public** — toggle Public on to give everyone with the link access.
To share your notebook:
Click the **Share** button in the top-right corner of the notebook.
In the Share dialog, choose who can access it:
* **Specific people** — share with individuals in the same aidnn account as you.
* **Public** — toggle Public on to give everyone with the link access.