Open a notebook
Once you’re in aidnn, you’re ready to run your first analysis and any analysis you run will be saved in Notebooks. Launch a notebook from the Home page. From any other page, click the Isotopes AI icon in the top-left corner to come back to Home.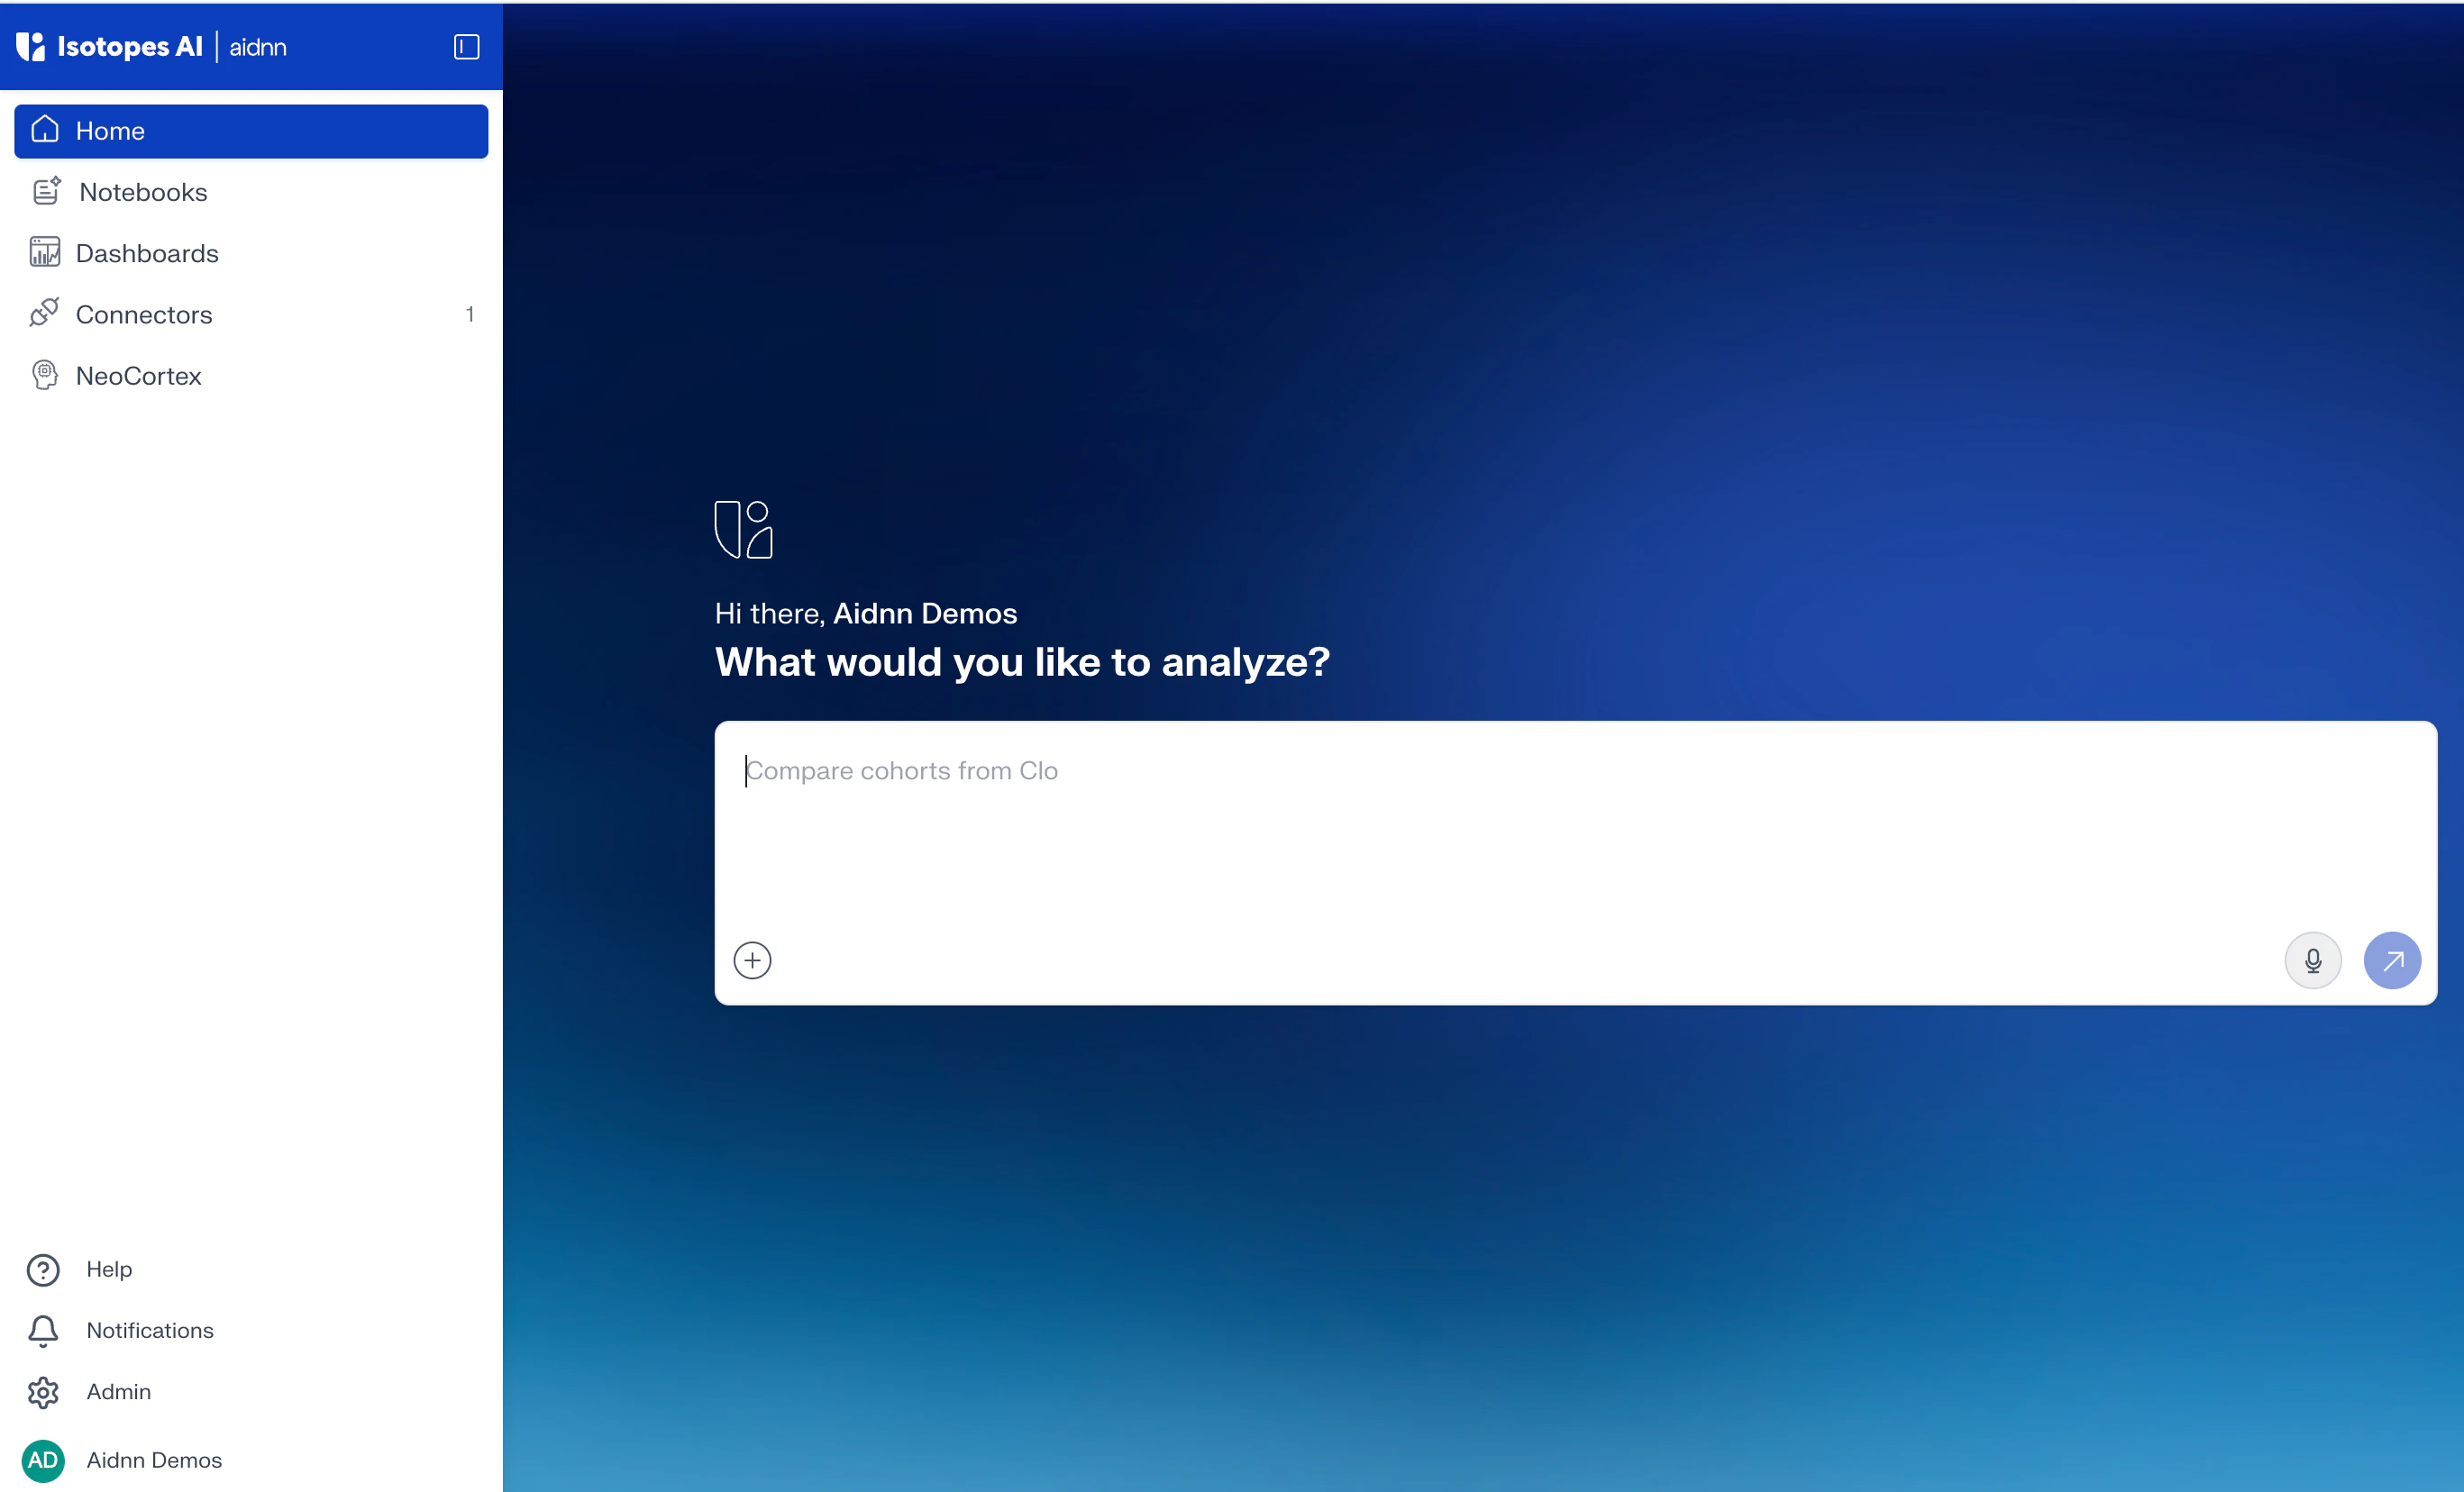
What you’ll analyze
You’ll build a 3-way match engine that reconciles every vendor invoice against the originating purchase order (PO) and the goods receipt (GR), flags exceptions and produces a row-level audit trail. The example uses one Excel workbook with three sheets:- Purchase Orders - the agreement: what your team committed to buy, at what price, from which vendor.
- Goods Receipts - what actually arrived at the warehouse, including any short-shipments or damage.
- Vendor Invoices - what the vendor is asking you to pay, including any duplicates, no-PO invoices or credit notes.
What aidnn will do for you
aidnn handles the entire analysis end to end, automatically and with full transparency. Behind the scenes it will:- Parse the workbook and normalize columns and types across the three sheets.
- Build a matching index that links each invoice to its PO (by PO #) and to any related GRs.
- Calculate price and quantity variances between invoice, PO and GR.
- Apply configurable tolerance thresholds anything inside tolerance is treated as a clean match; anything outside becomes an exception.
- Detect duplicate invoices by matching prior bills with the same PO number, vendor, and amount.
- Classify every invoice into one of seven classes: Full Match, Price Exception, Qty Mismatch, Hold (no GR), Duplicate, No PO or Credit Note.
- Produce a row-per-invoice audit table that records the source rows, the variances, the active tolerances and the rule that fired.
1. Kick off the analysis
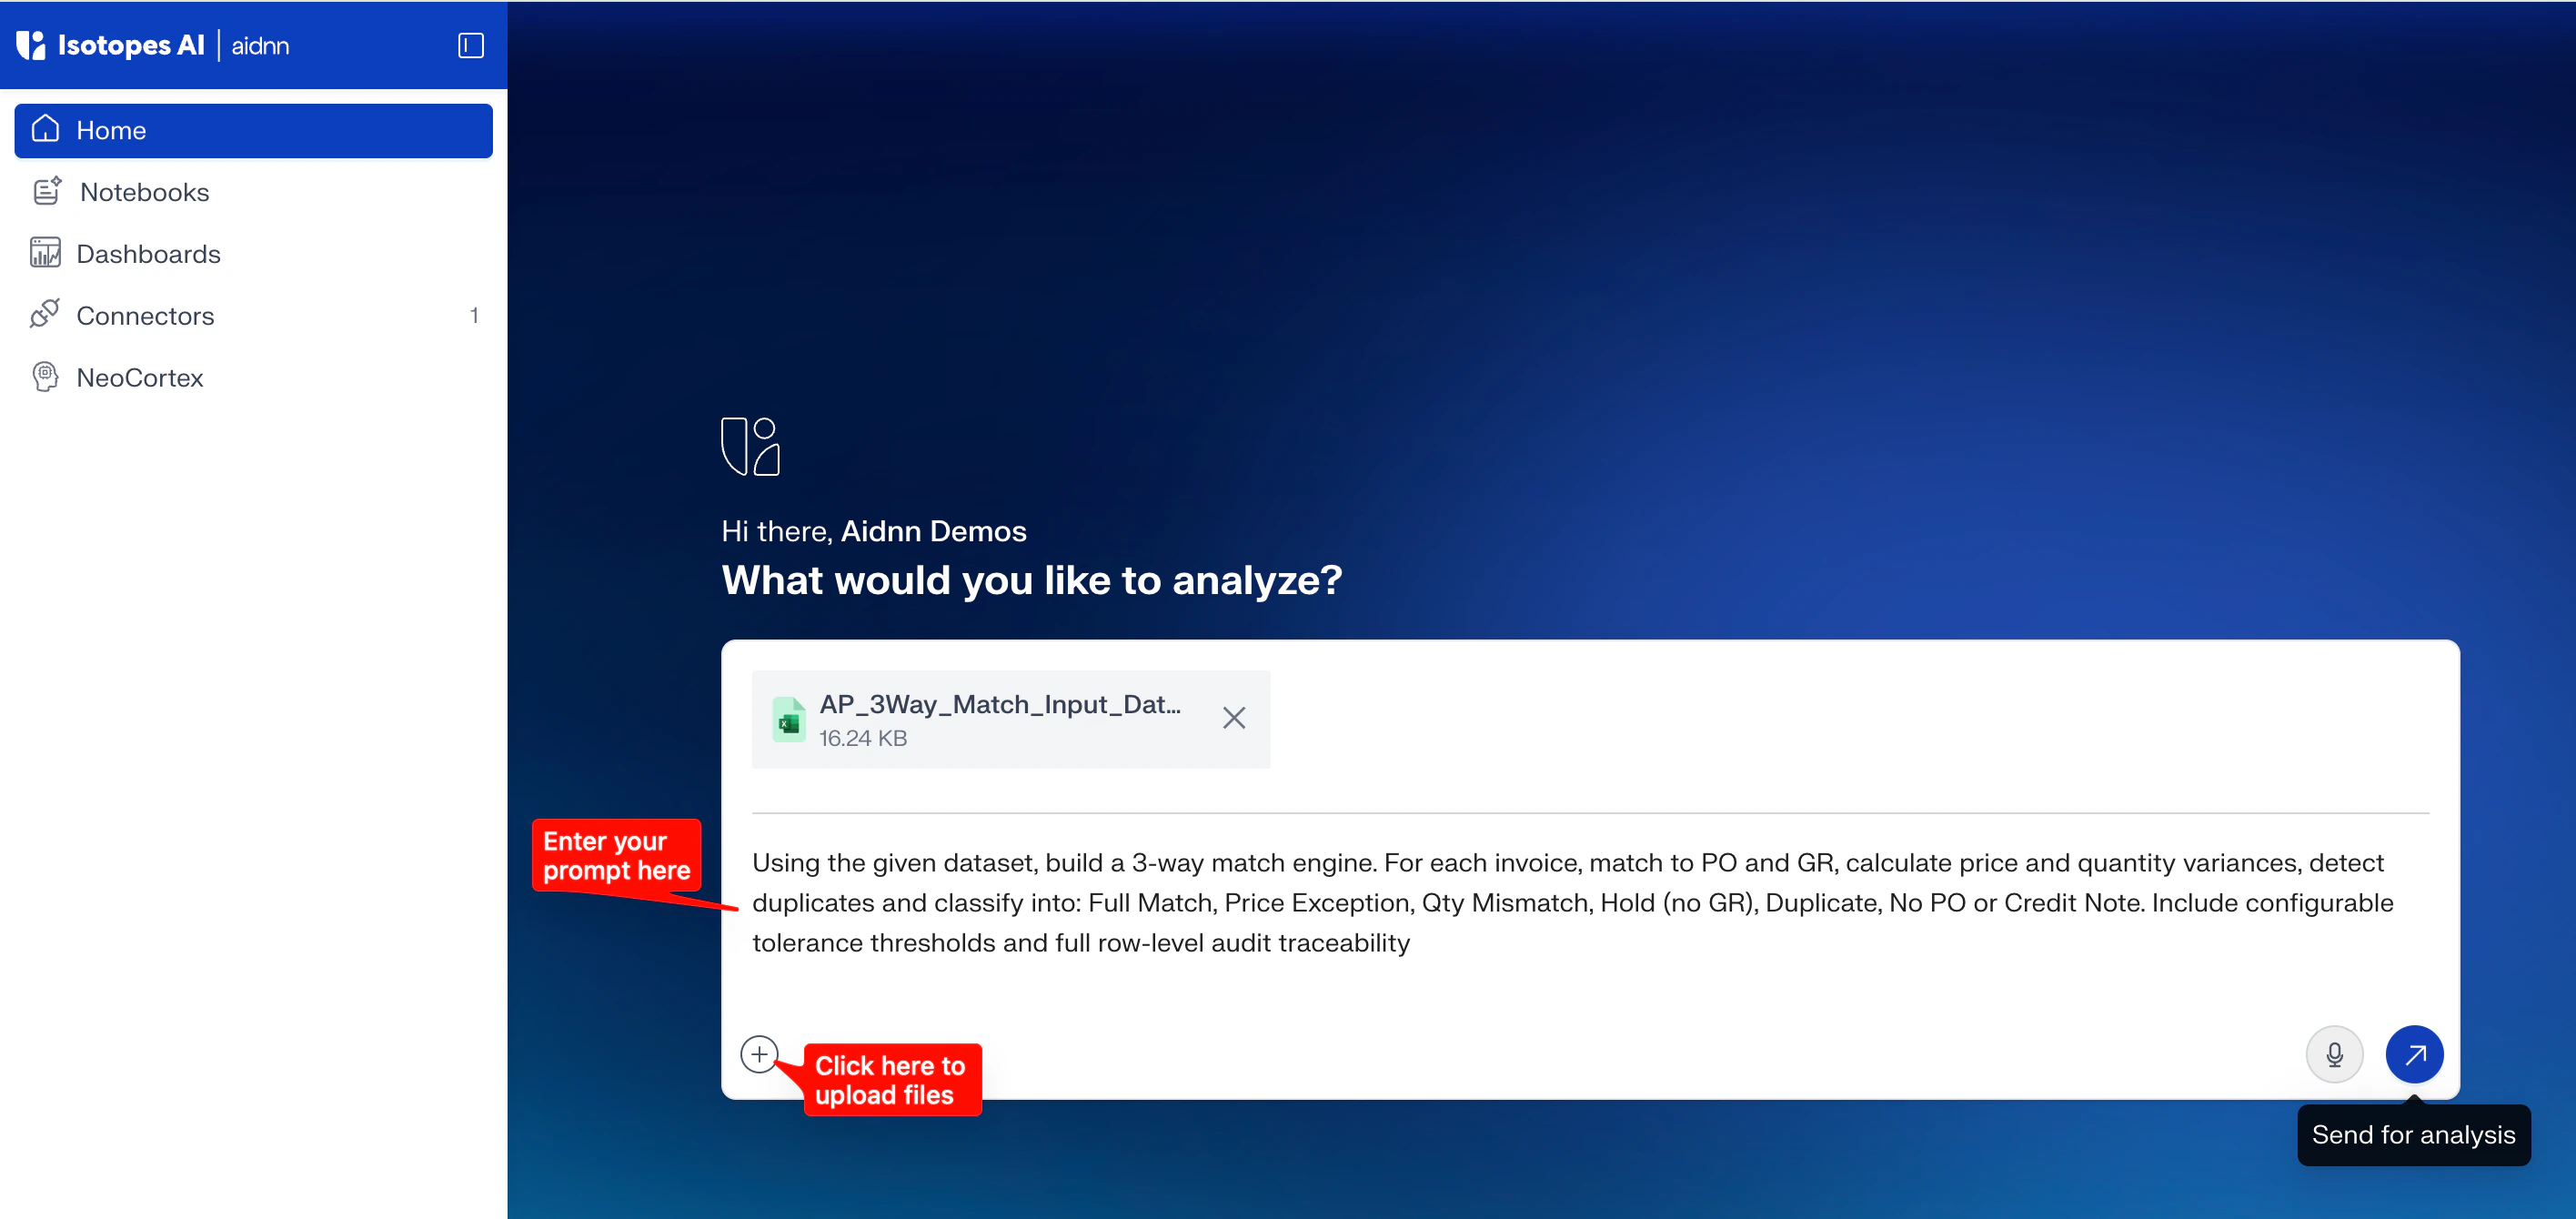
Submitting one prompt and uploading the workbook is enough to launch the entire analysis.- Open the prompt window on Home. Paste this prompt: “Using the given dataset, build a 3-way match engine. For each invoice, match to PO and GR, calculate price and quantity variances, detect duplicates and classify into: Full Match, Price Exception, Qty Mismatch, Hold (no GR), Duplicate, No PO or Credit Note. Include configurable tolerance thresholds and full row-level audit traceability”
- Click the file upload button and attach AP_3Way_Match_Input_Data.xlsx.
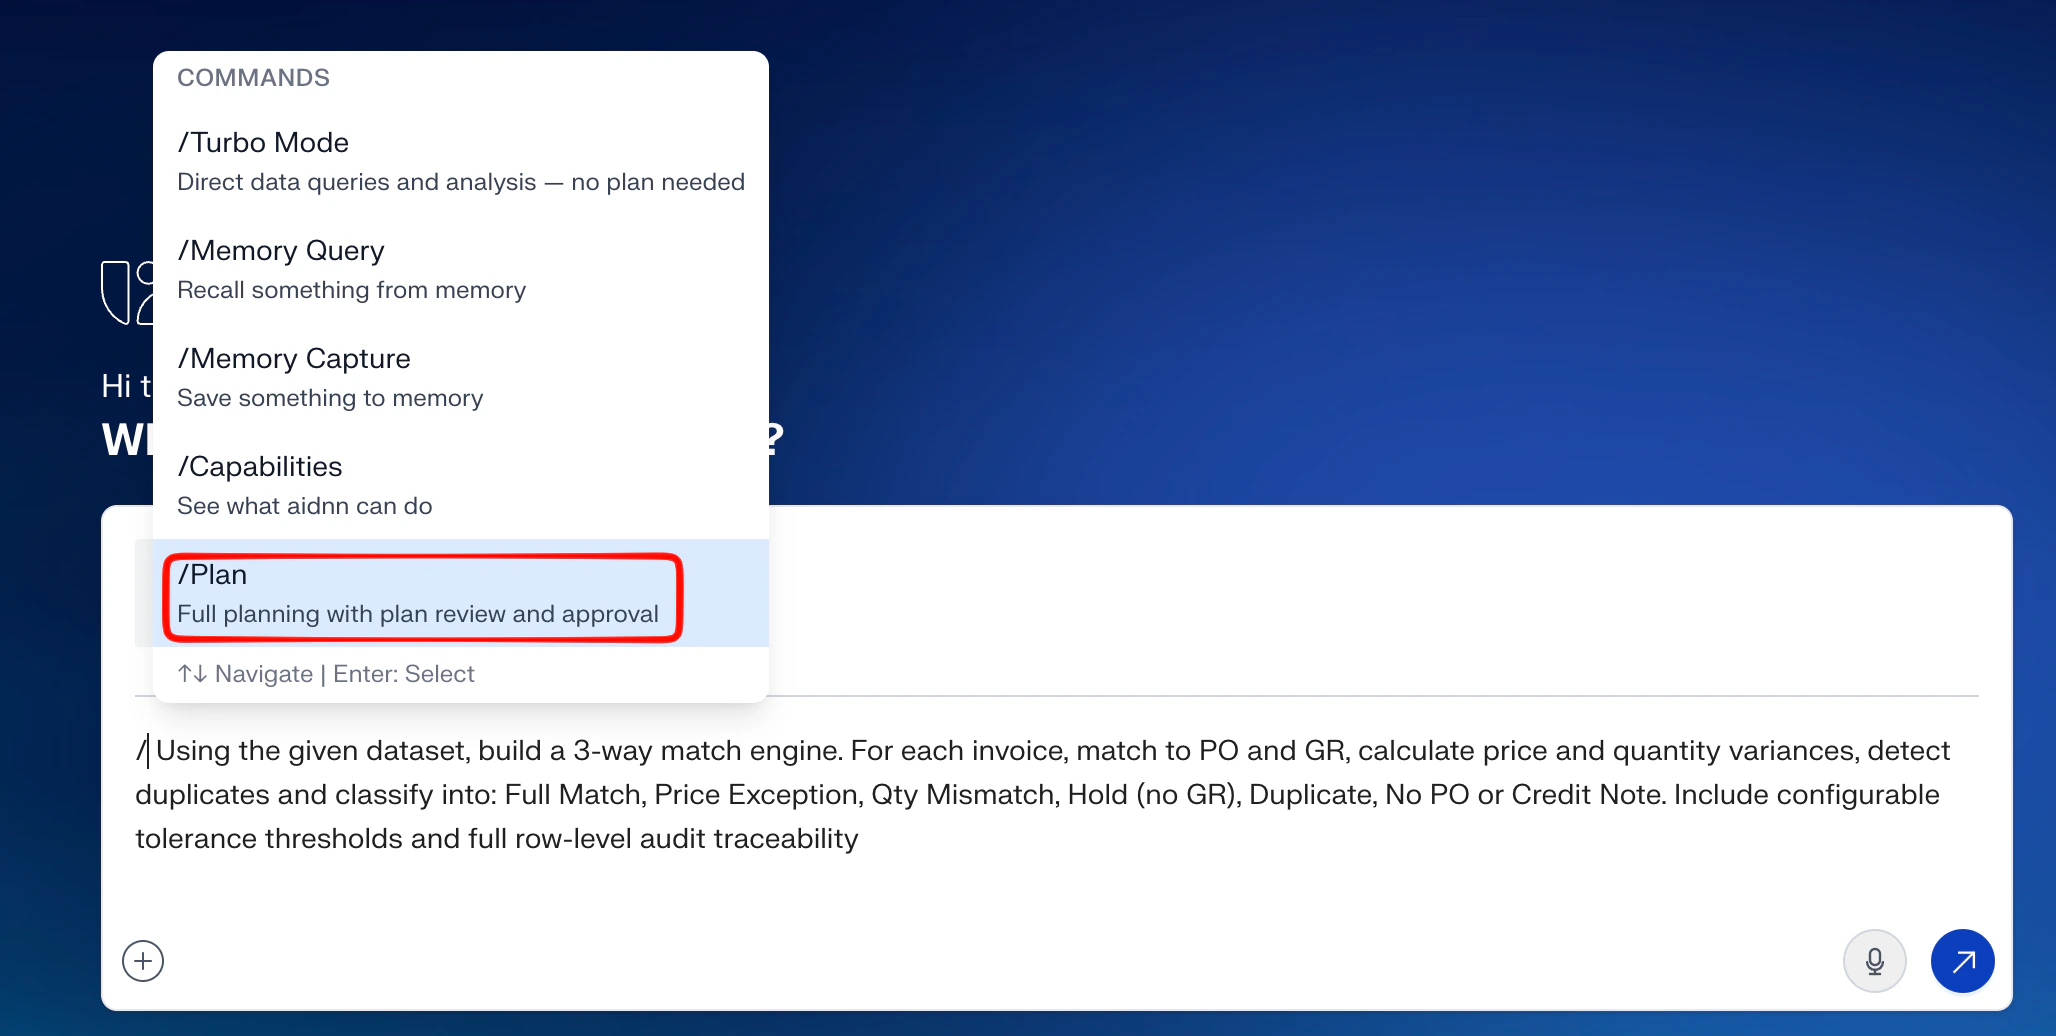
- To choose the type of analysis enter ” / ” in the prompt box to open the commands menu and select
- Submit. aidnn opens a new notebook and starts thinking through the prompt.
2. Review the plan
aidnn produces a step-by-step plan that lays out the approach it intends to take typically something like: load the three sheets, build the matching index, compute variances, apply tolerances, classify and produce the audit table.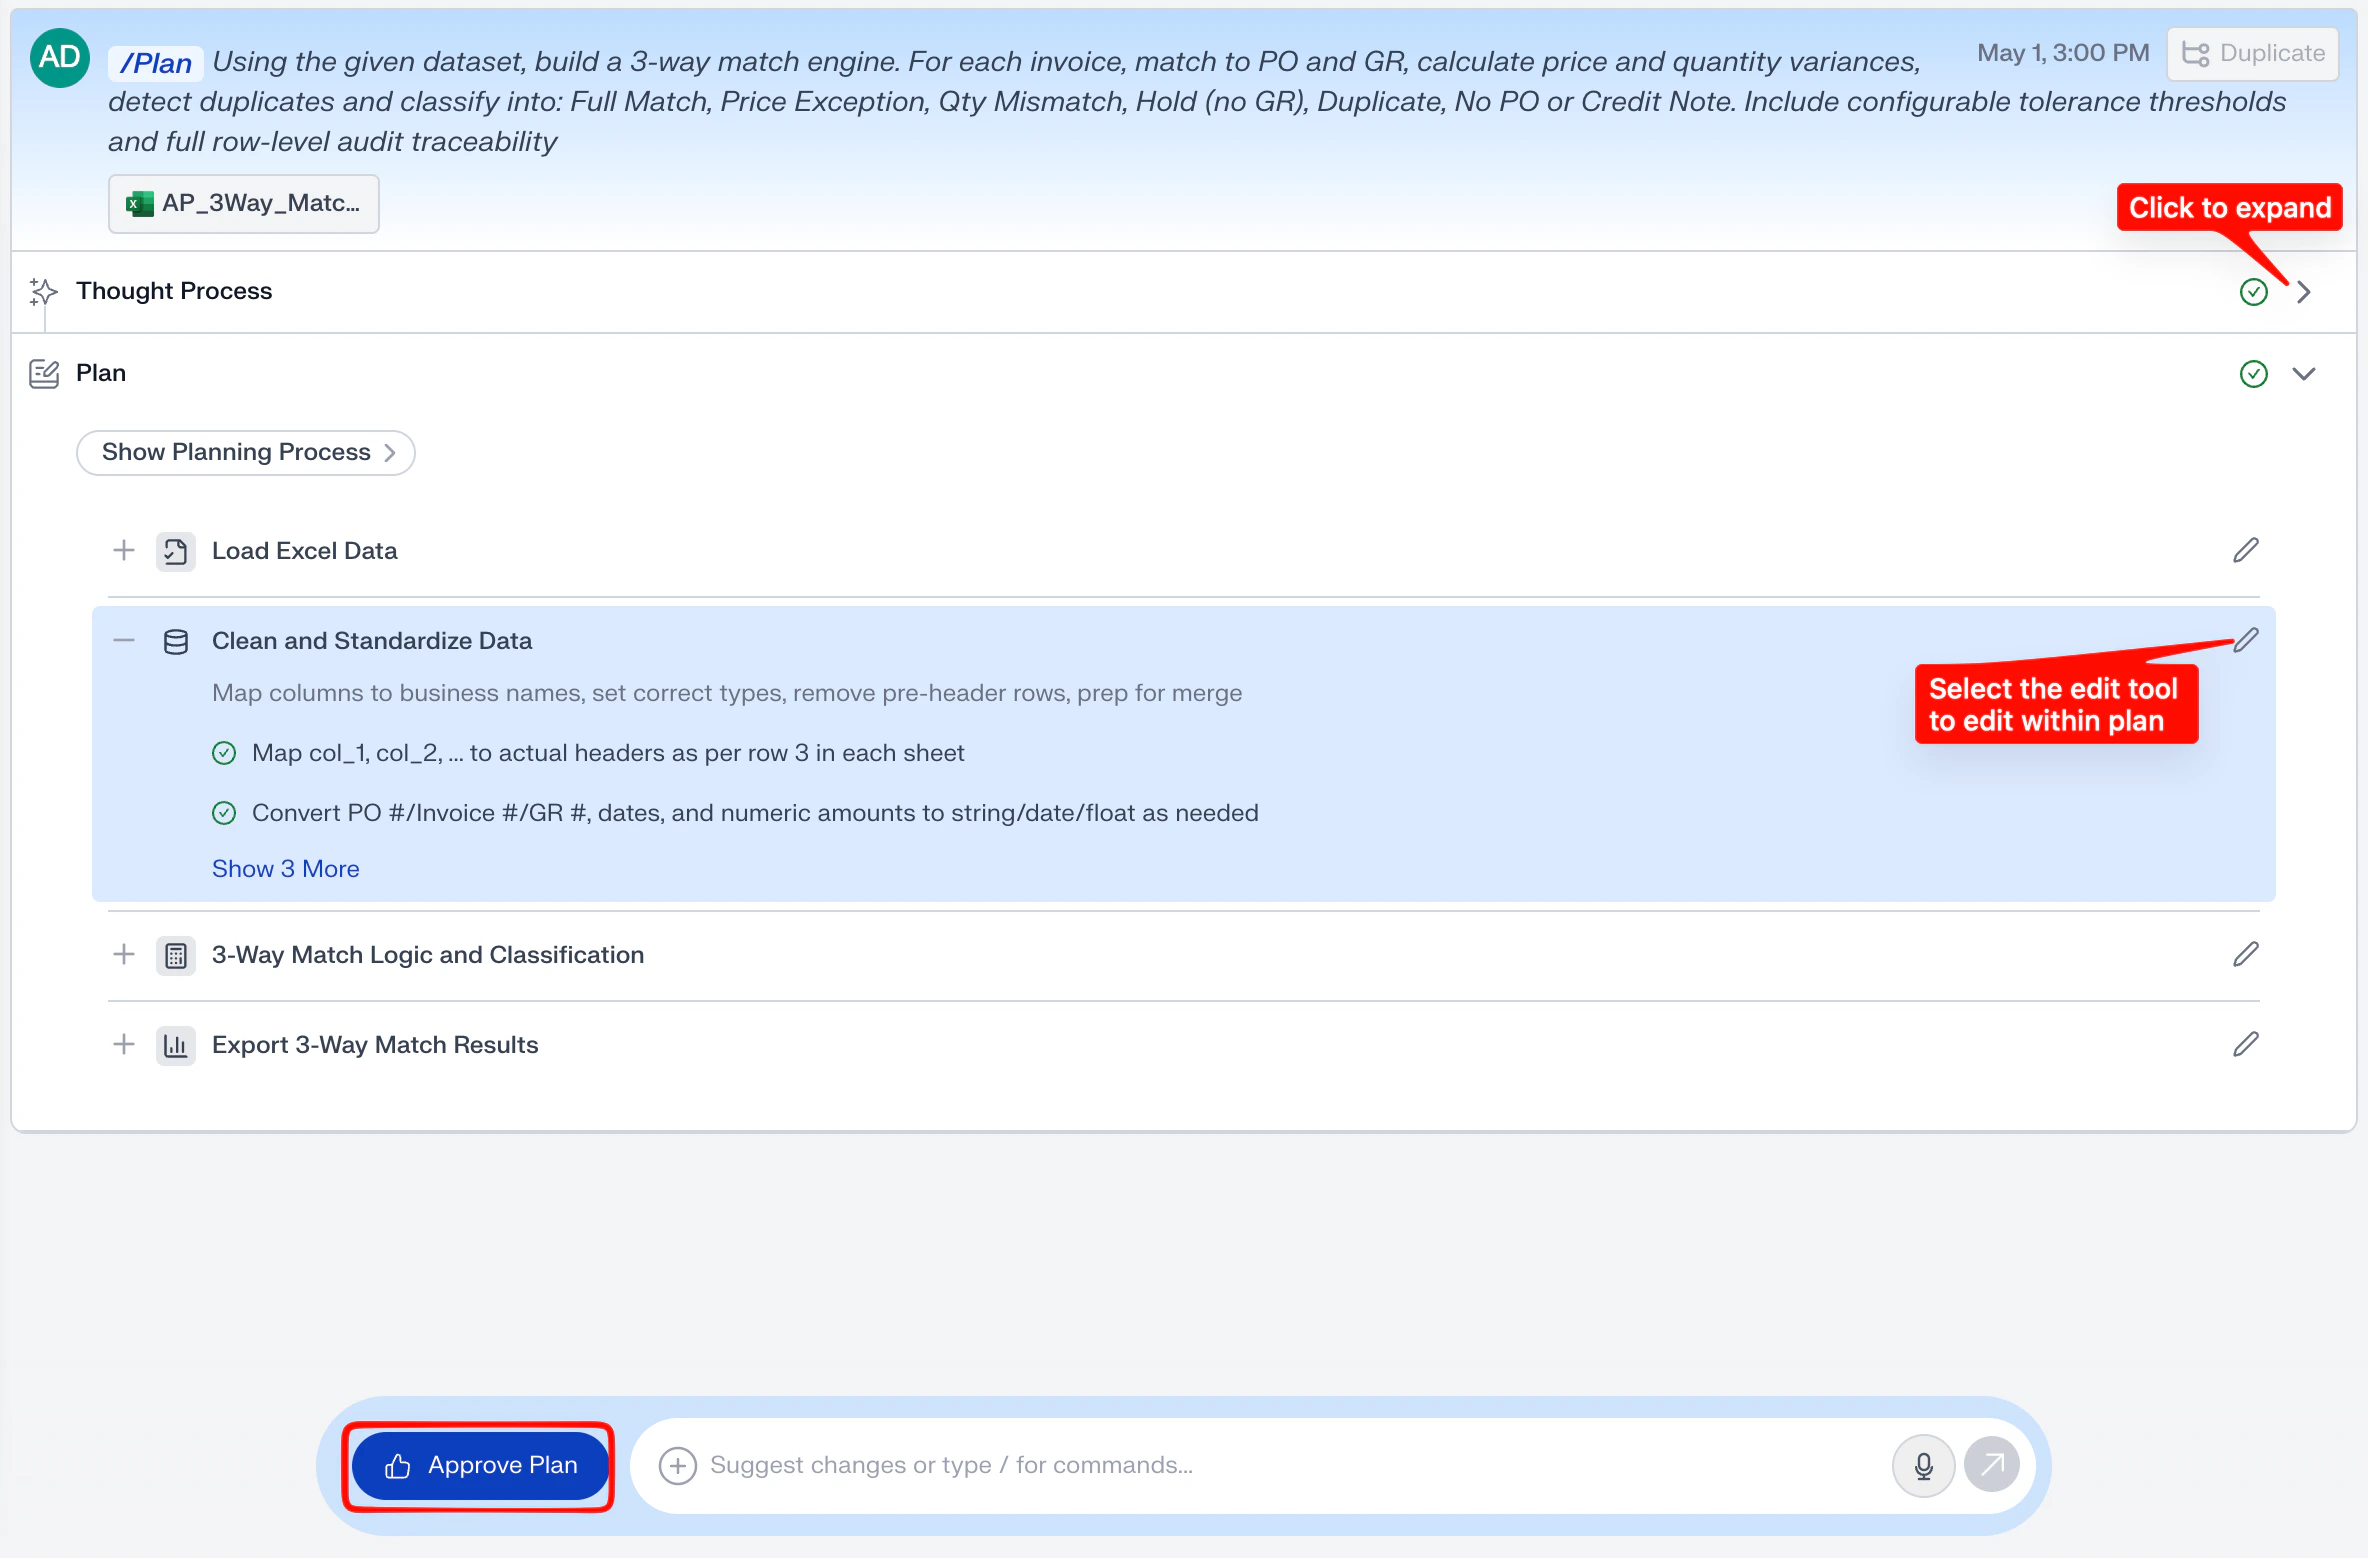
3. Revise the plan (optional)
Most users won’t need to revise the plan for this example. If you do want to change something say, tighten the price tolerance from 2% to 1% you have three ways to do it:- Edit a single step in any section of the plan click the pencil to edit the step in place.
- Add a new step - use the same hover-and-click flow to insert a new step into the plan.
4. Watch the plan execute
Once you approve the plan, aidnn runs each step in order. As steps run, you can click into any of them to see exactly what happened.Each execution step exposes:
- The input data extracted from the file you uploaded.
- The processing aidnn ran at that step, including any formulas or transformations applied for the variance step you can see the exact arithmetic, row by row.
- A summary - rows filtered, input row count, output row count.
- The intermediate data produced viewable, validatable and auditable later.
5. Read the results
When execution completes, aidnn generates a results page that summarizes the analysis. For this example you’ll see:- A breakdown of the seven classes with the count of invoices in each (most invoices full-match; the rest land in the exception classes).
- The row-level audit table - one row per invoice with the matched PO and GR, the calculated variances, the classification and a short reason explaining why aidnn picked that class.
- A narrative about the analysis - total dollar exposure across exceptions, the largest single variance, any vendors with multiple flags, and recommendations for which invoices to follow up on first.
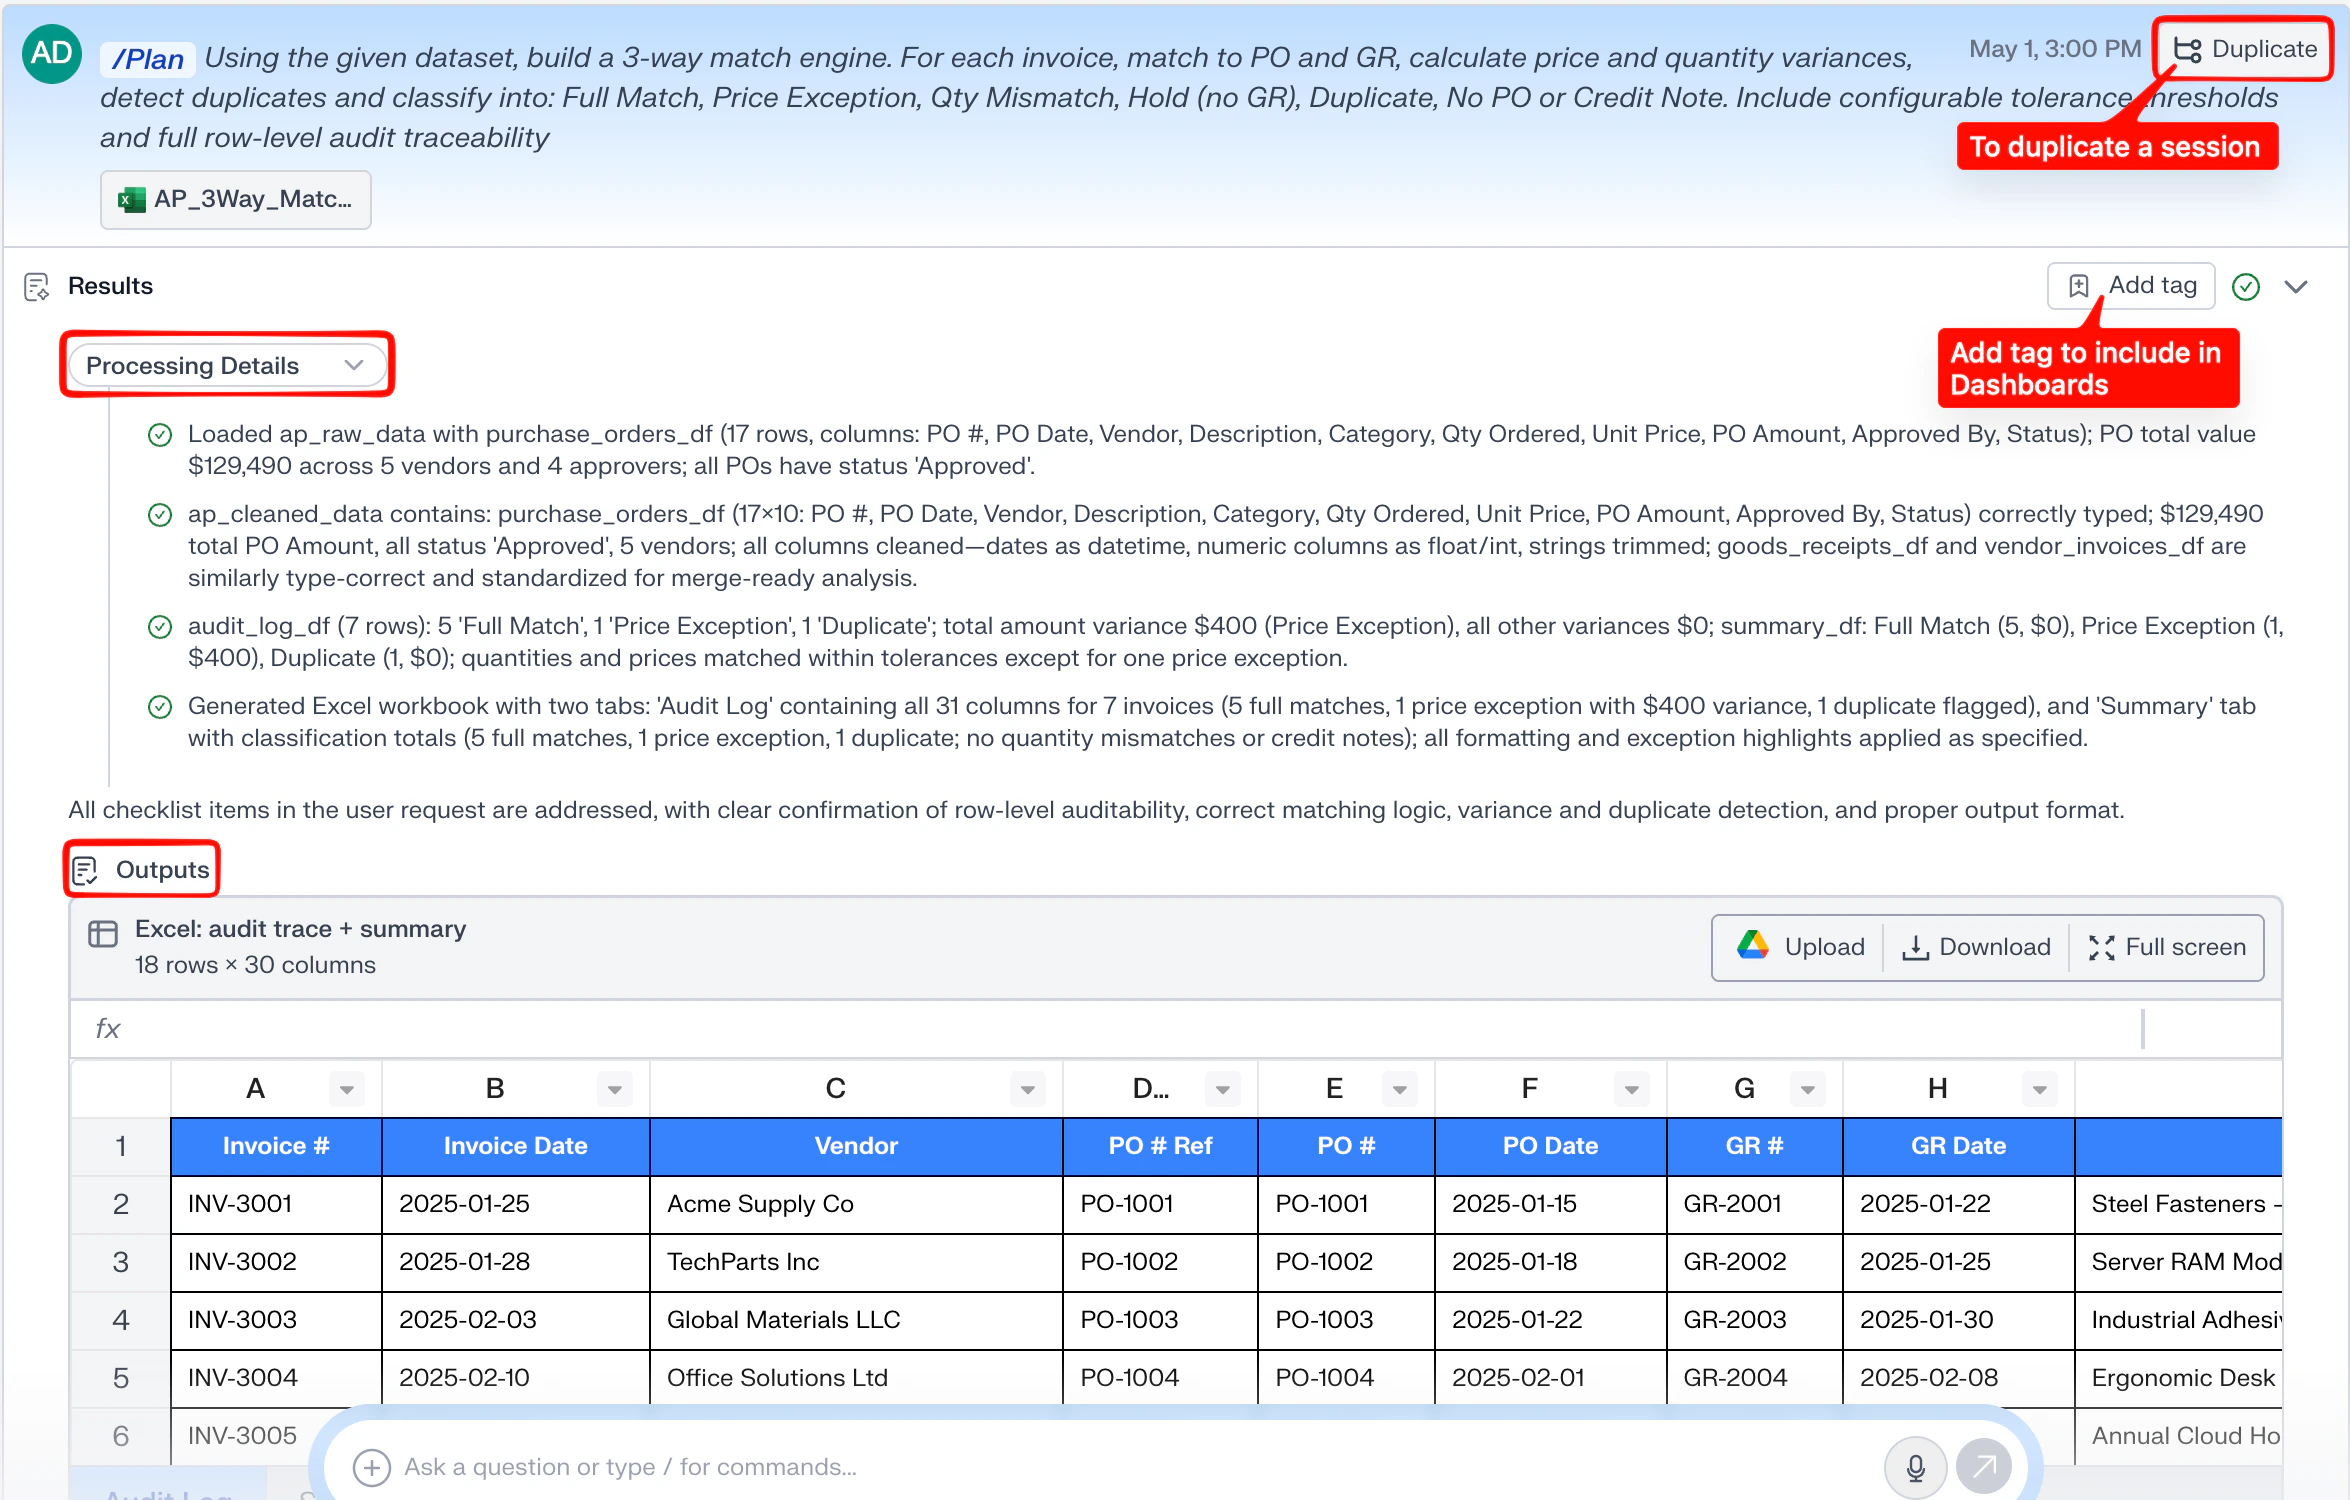
Save the session into a Dashboard
Click Add tag in the Results header to tag the session. Tagged notebooks roll up into Dashboards, so you can group every 3-way match run into a single “Month-end AP close” Dashboard alongside other recurring AP analyses. See the Dashboards guide for the full flow.Branch the session
Click Duplicate in the top-right of the prompt header to fork the current session. Duplicating gives you a clean copy with the same prompt, files, and plan — perfect for trying a different tolerance, swapping the dataset, or rerunning the analysis without losing the original audit trail. Both copies stay in your Notebooks list, so you can compare them side by side later.How a notebook is structured
The analysis you just ran is the first one inside a Notebook. Each analysis has two parts:- The analysis side panel - on the left side of the notebook. It shows the analysis at a glance: your prompt, aidnn’s thought process, the plan, the execution steps and the results.
- The analysis details - fills the rest of the notebook. Click any section in the side panel (Plan, Execution, Results, etc.) to drill into its details. The Plan view lets you edit; the Execution view shows the intermediate data from each step; the Results view shows the audit table and narrative.
Continue the analysis
You don’t have to stop after one analysis. For example, ask aidnn to roll the audit results up by vendor so you can see which suppliers are responsible for the most exception value:- In the analysis side panel on the left, click the Results section.
- Scroll to the prompt window at the bottom of the page (“Ask a question or type / for commands…”).
- Submit a follow-up prompt for example, “Group the exceptions by vendor and show total dollar variance per vendor as a bar chart.” aidnn runs a new analysis on top of the audit table you’ve already built.