Working with aidnn
When you log in, you land on the Home screen. This is the easiest place to get started: type a prompt, attach a file and let aidnn take it from there. Everything else in aidnn is one click away via the left sidebar, which is visible on every screen.
Left Sidebar
The left sidebar is how you move between the main sections of the platform:- Home - the prompting window, where every new analysis starts.
- Notebooks - every analysis you have run, saved for you to reopen, share, or archive.
- Dashboards - collections of notebooks grouped by tag, so related analyses live together.
- Connectors - the data sources aidnn can read from (QuickBooks, NetSuite, Snowflake, and more).
- NeoCortex - aidnn’s memory. Store company context, definitions, and preferences so every analysis starts with the right background.
Home
The Home screen is built around a single prompting window. Describe what you want to analyze in plain language, attach the input file (CSV, Excel, PDF, and more), and click Start your analysis. aidnn takes you straight into a new notebook and begins working.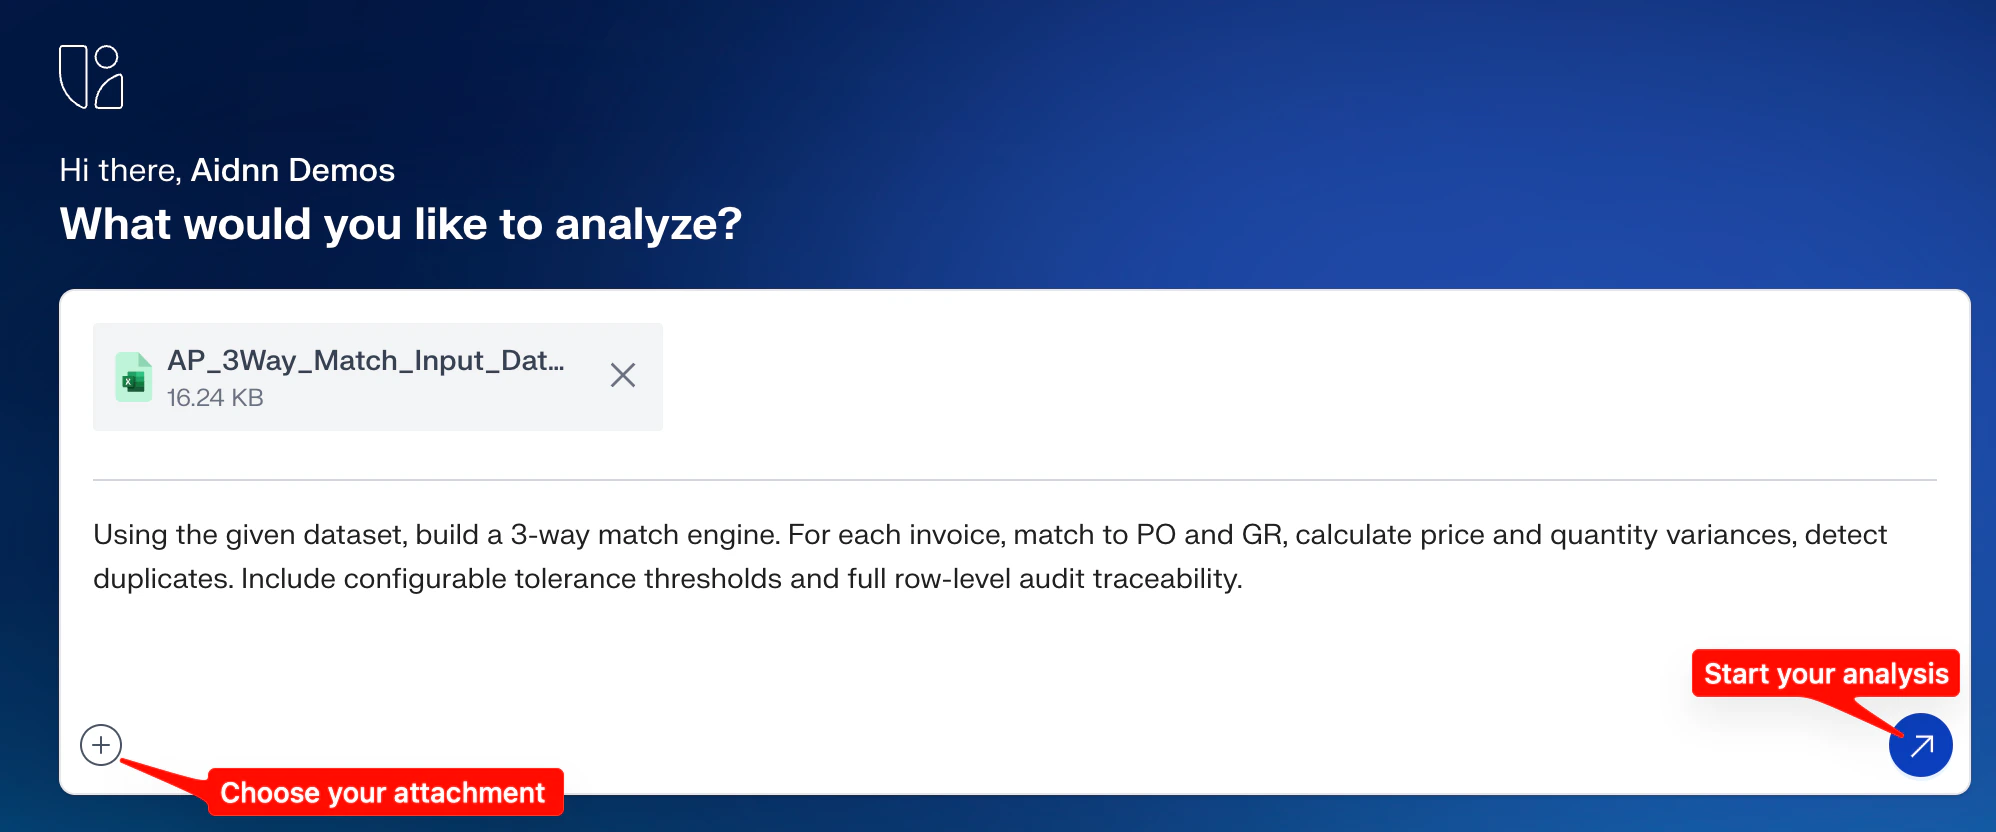
- Plain language works - you don’t need to phrase prompts a special way. “Build a 3-way match engine for these invoices” is enough.
- Attachments are optional - if your data already lives in a connected source, aidnn can pull it from there instead.
- One click, one notebook - every run creates a new notebook, so nothing overwrites your previous work.
Notebooks
Every analysis aidnn has run is saved as a notebook. Open the Notebooks tab to see the full list each row shows the notebook title, status, access level, and when it was last updated.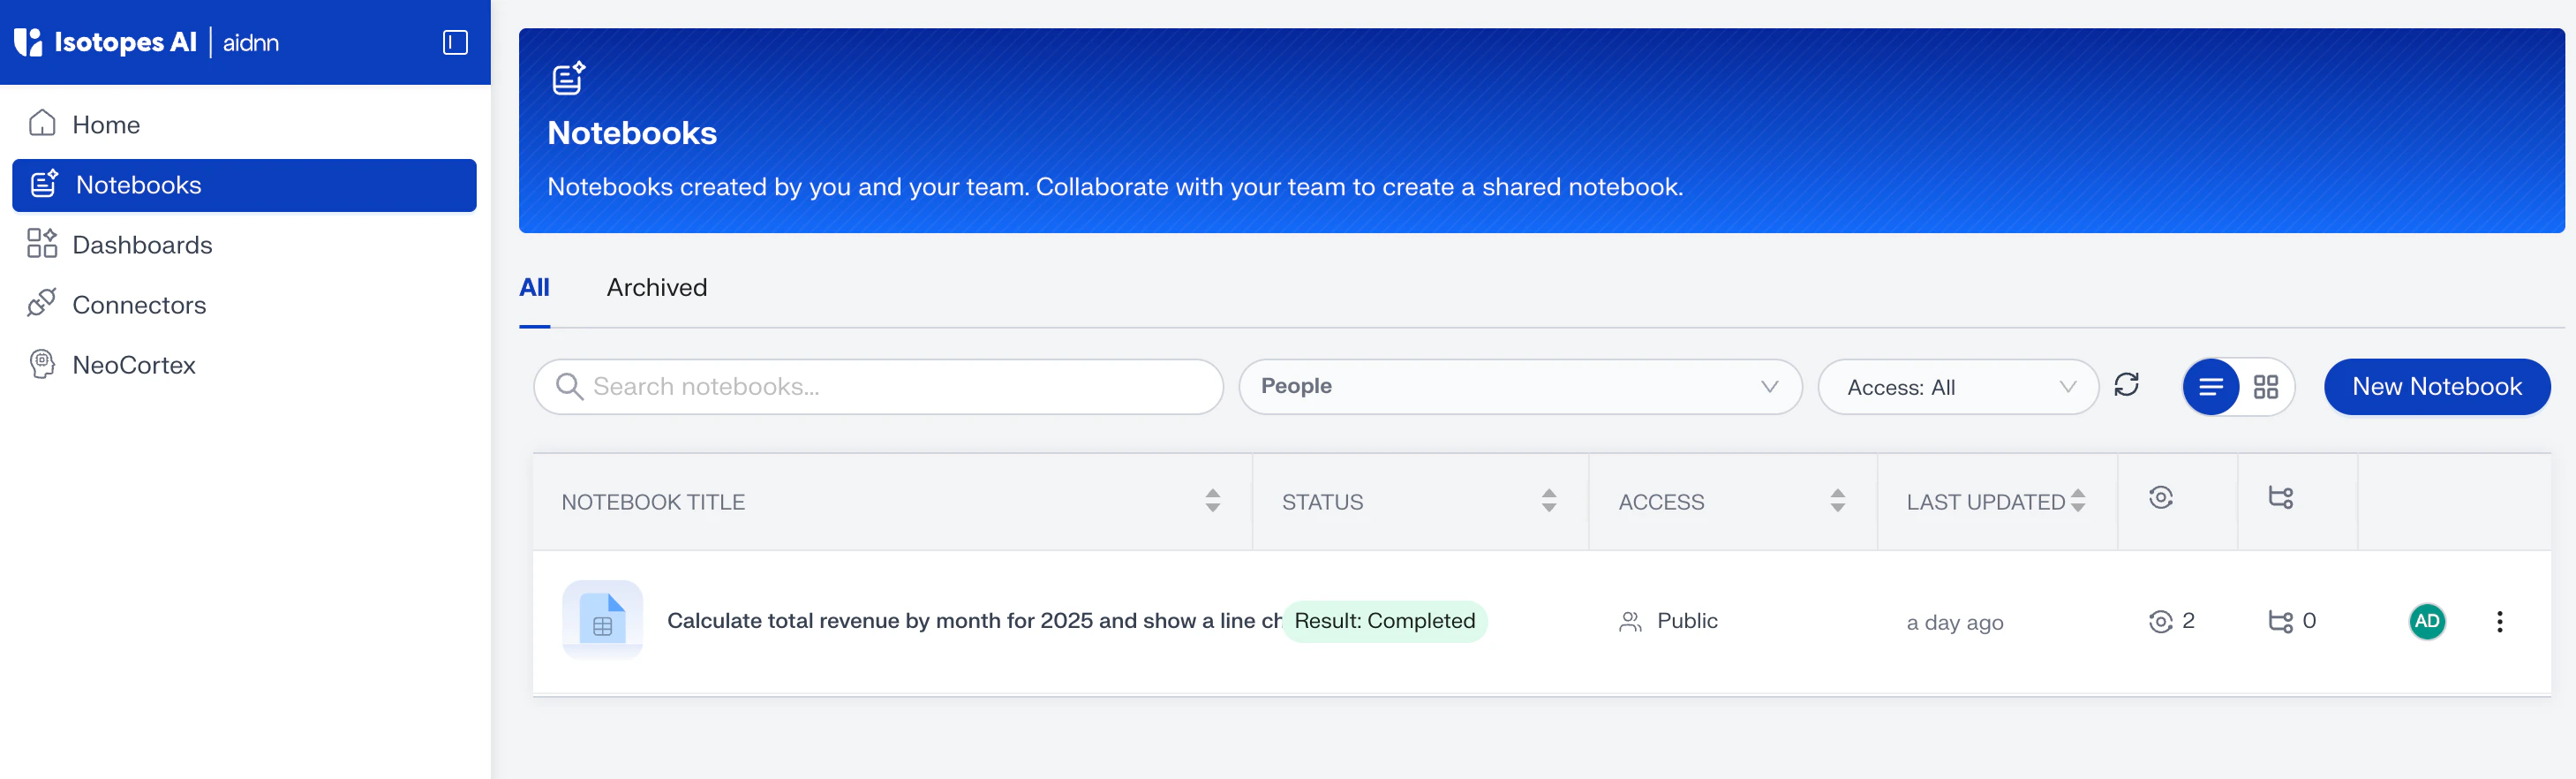
- Open a notebook - click any row to jump back into that analysis and pick up where you left off.
- Start a new one - use the New Notebook button in the top right to open a fresh prompting window without leaving this page.
- Archive or unarchive - deleted notebooks become read-only and move to the Archived tab. You can restore them at any time.
Dashboards:
A Dashboard is a collection of notebooks, grouped so you can see related analyses in one place a monthly revenue view, an AP audit view, a close checklist, whatever pattern fits your team.Notebooks are pulled into a dashboard by tag. You create tags inside a notebook, then reference those tags when building the dashboard.
Step 1 — Add a tag to a notebook
Open the notebook you want to group, then on the results screen click Add tag (top right). Type a descriptive tag name for example Revenue 2025 and press Enter to save it. Repeat for any other notebooks you want grouped under the same tag.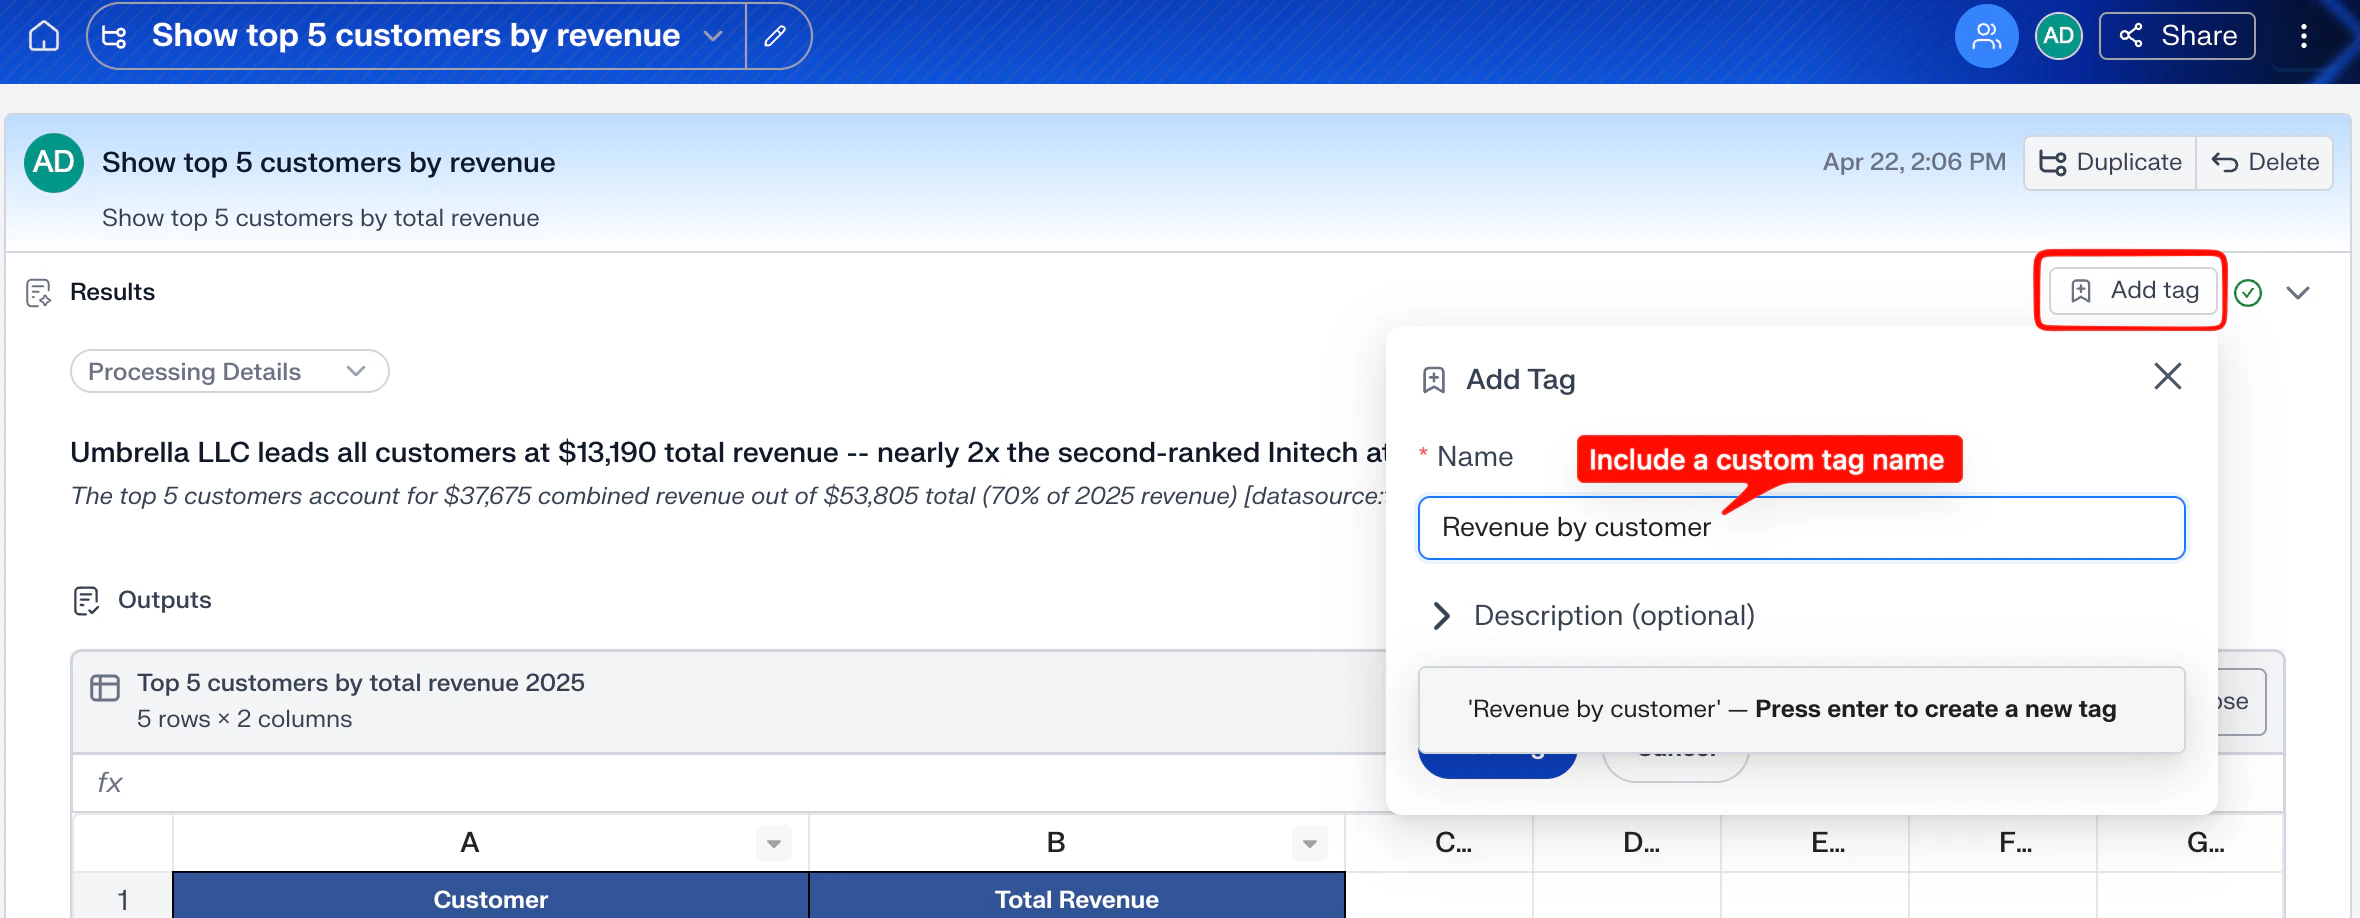
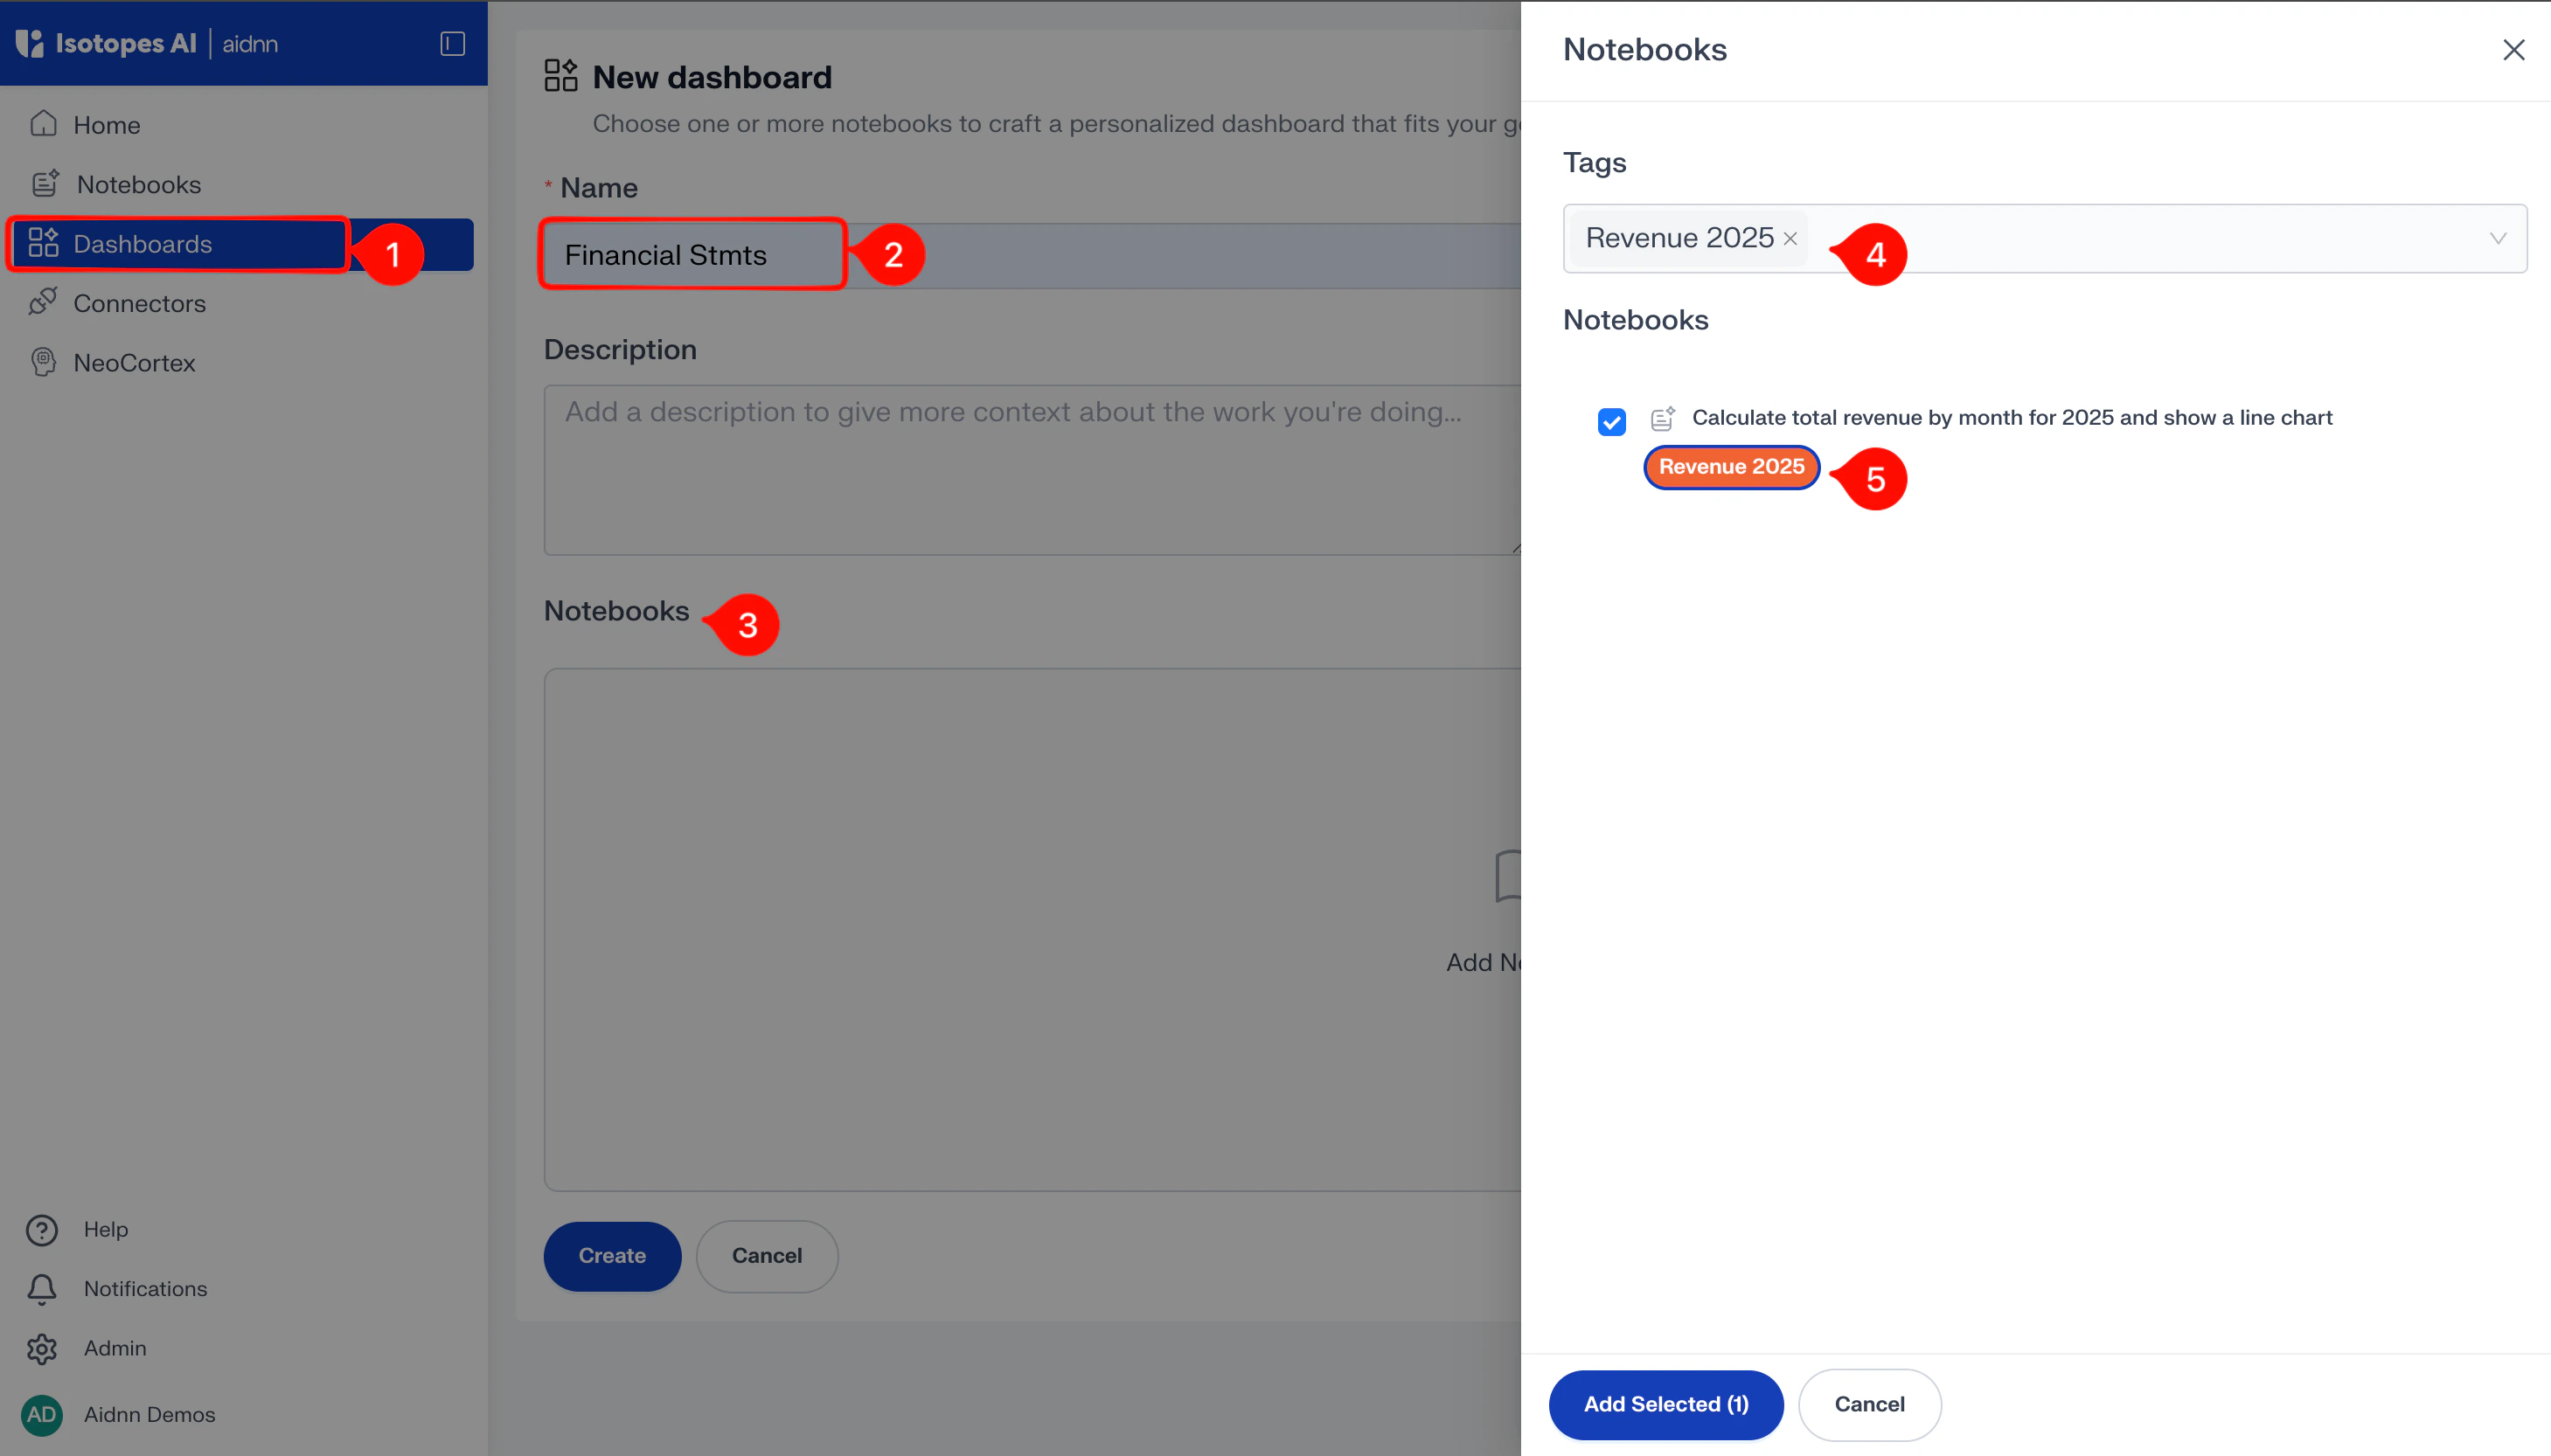
Step 2 — Build a dashboard from tagged notebooks
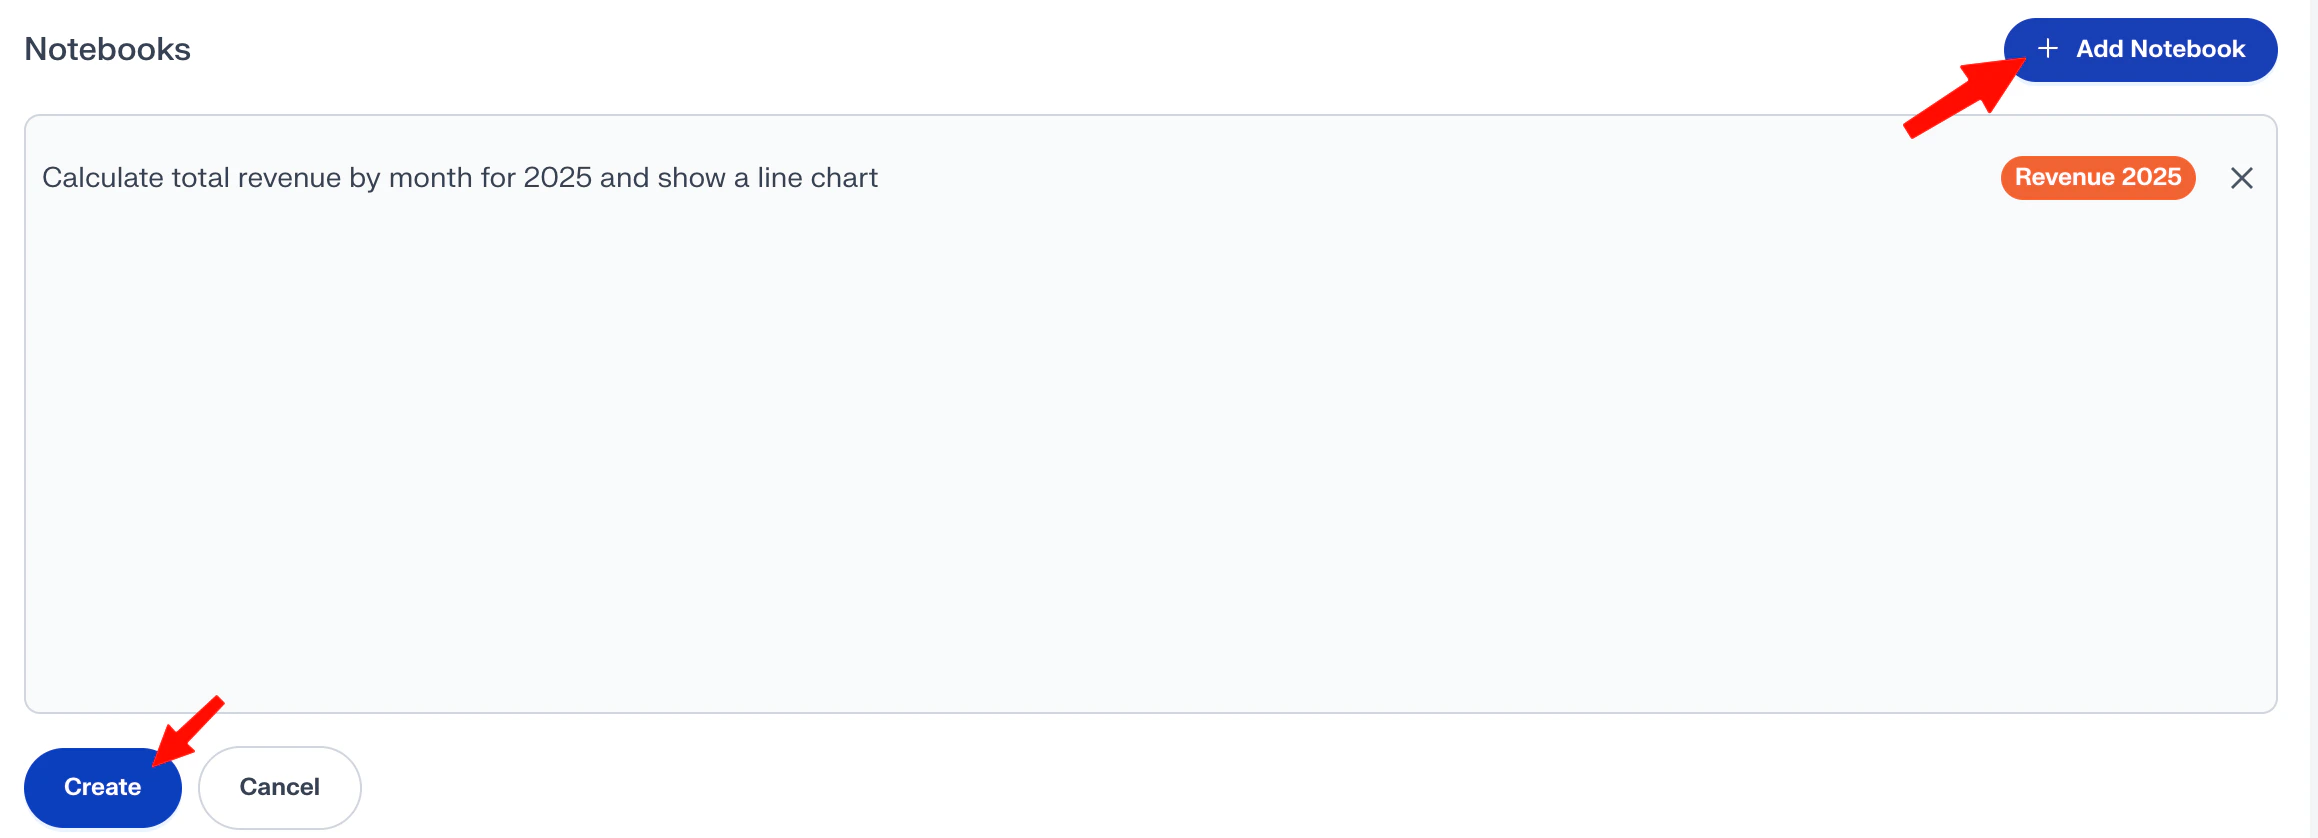
From the left sidebar open Dashboards, then click New Dashboard in the top right. Give the dashboard a name, then inside the Notebooks section click Add Notebook to open the picker.In the picker, choose the tag you created (for example Revenue 2025). Every notebook that carries that tag appears in the list. Check the ones you want, click Add Selected, then Create.
Connectors
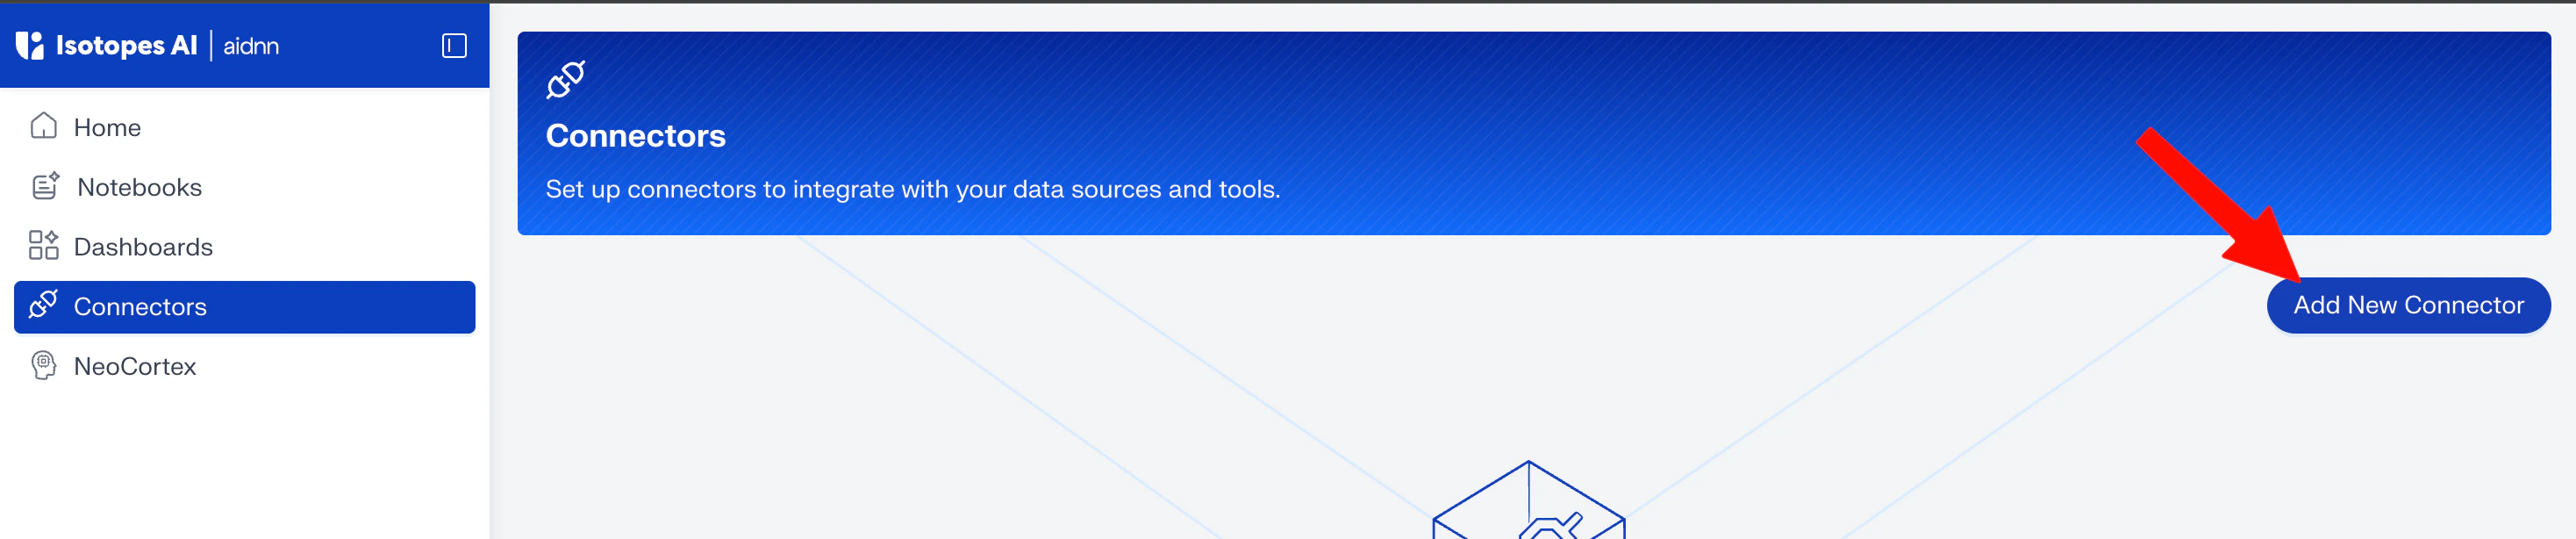
Connectors are how aidnn reads data directly from the tools you already use — NetSuite, QuickBooks, Snowflake, BigQuery, Google Drive, Notion, and more. Behind the scenes each connector is an MCP integration, so once it’s set up, aidnn can pull the data it needs without you exporting and uploading files.You can add as many connectors as you need. To create one, open Connectors from the left sidebar and click Add New Connector in the top right.

NeoCortex
NeoCortex is aidnn’s memory. Anything you save here a fiscal-year definition, a product taxonomy, a team naming convention becomes context that aidnn reads on every relevant prompt.The classic example: your company’s financial year runs February to January, not January to December. Store that in NeoCortex once, and every future prompt that mentions “financial year” gets interpreted correctly without you re-explaining it. Each memory has a scope that controls who it applies to:
- User - only you see it. Useful for personal shortcuts and preferences.
- Organization - shared across everyone in your workspace. Best for company-wide facts.
- Session - lasts only for the current session. Useful when you want temporary context without it sticking around.
Add a memory
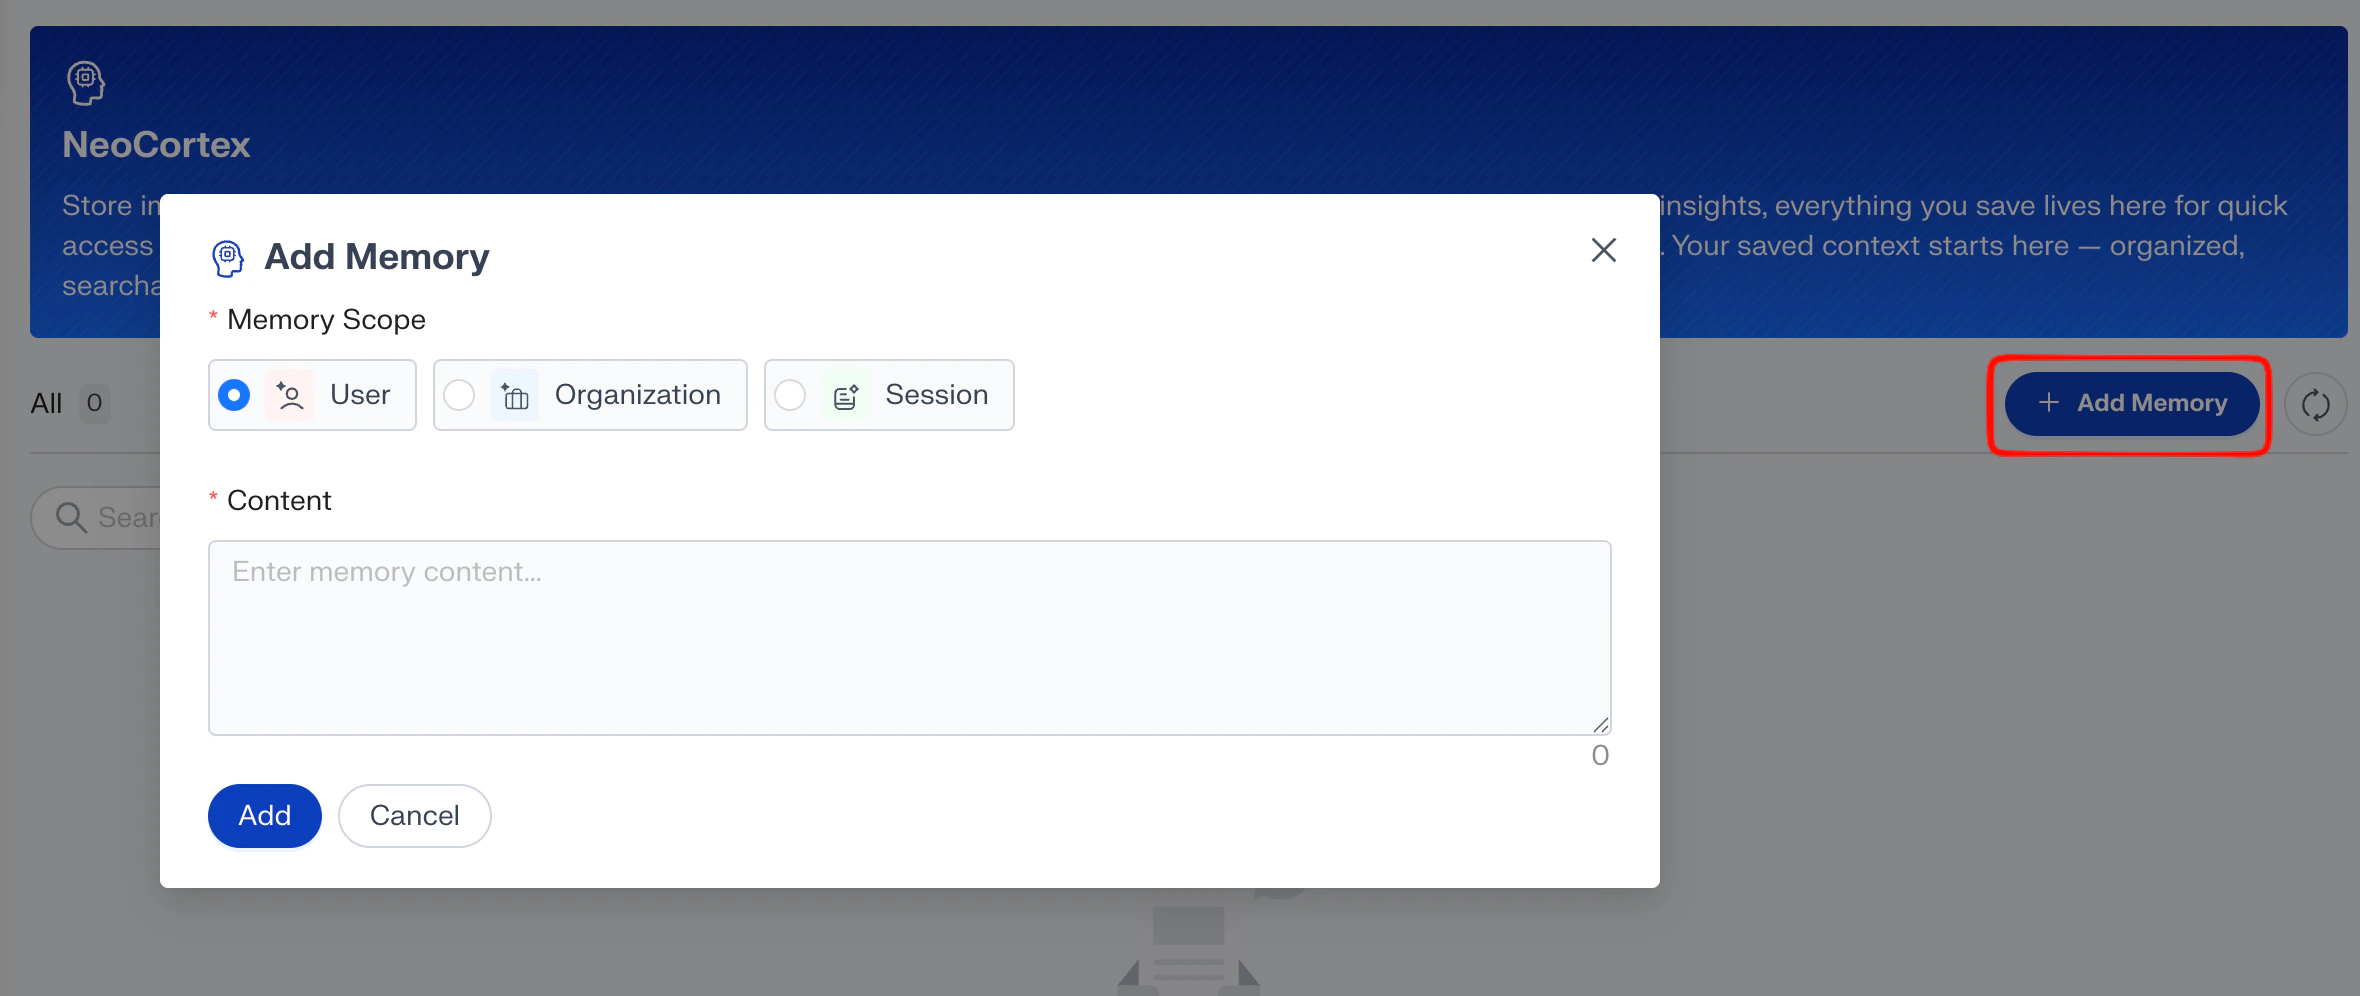
Open NeoCortex from the left sidebar and click Add Memory in the top right. In the Add Memory dialog:- Pick a Memory Scope - User, Organization, or Session.
- Write the content - what you want aidnn to remember, in plain language.
- Click Add - the memory is now available on every future prompt inside that scope.
What’s next
You now know the five main areas of aidnn and how they fit together: Home to ask, Notebooks to revisit, Dashboards to group, Connectors to bring in data, and NeoCortex to make aidnn smarter about your business.A good next step is to run your first real analysis. See Create your first notebook for a guided walk-through.