Organize recurring analyses with Dashboards
Dashboards in aidnn is a dedicated area for grouping related notebooks into a single project a place to keep recurring work (monthly revenue, board decks, payroll reconciliation) organized, easy to revisit and easy to share. This guide covers what Dashboards are, why you’d use one, and how to create and work with your first Dashboard. This guide walks you through what Workspaces are, why you need them and how to create and manage your first Workspace.A Dashboard groups notebooks that share a purpose typically analyses you re-run on a regular cadence (weekly, monthly, quarterly). Think of it as a smart folder that helps you organize related notebooks, re-run them on a schedule, generate insights across the group for reporting and compare results side by side.
Why create a Dashboard?
- Organization and flow - keep every analysis for a specific topic (monthly financial reporting, AP audits, product analytics) grouped together, so recurring work has a consistent home.
- Side-by-side insight - put related notebooks next to each other to spot patterns, inconsistencies, or drift between periods.
- Team collaboration - share a Dashboard so everyone on the team lands on the same grouped analyses and can build on top of them.
- Reporting - give executives one link that surfaces every metric, plus comparisons across previous months or quarters.

Create your first Dashboard
Open Dashboards and start a new one
Click Dashboards in the left sidebar. You’ll see any existing Dashboards (yours and ones shared with you). In the top-right corner, click New Dashboard to start building.Name your Dashboard
Give the Dashboard a name that reflects the purpose of the group. A short description is optional but useful once you have several Dashboards.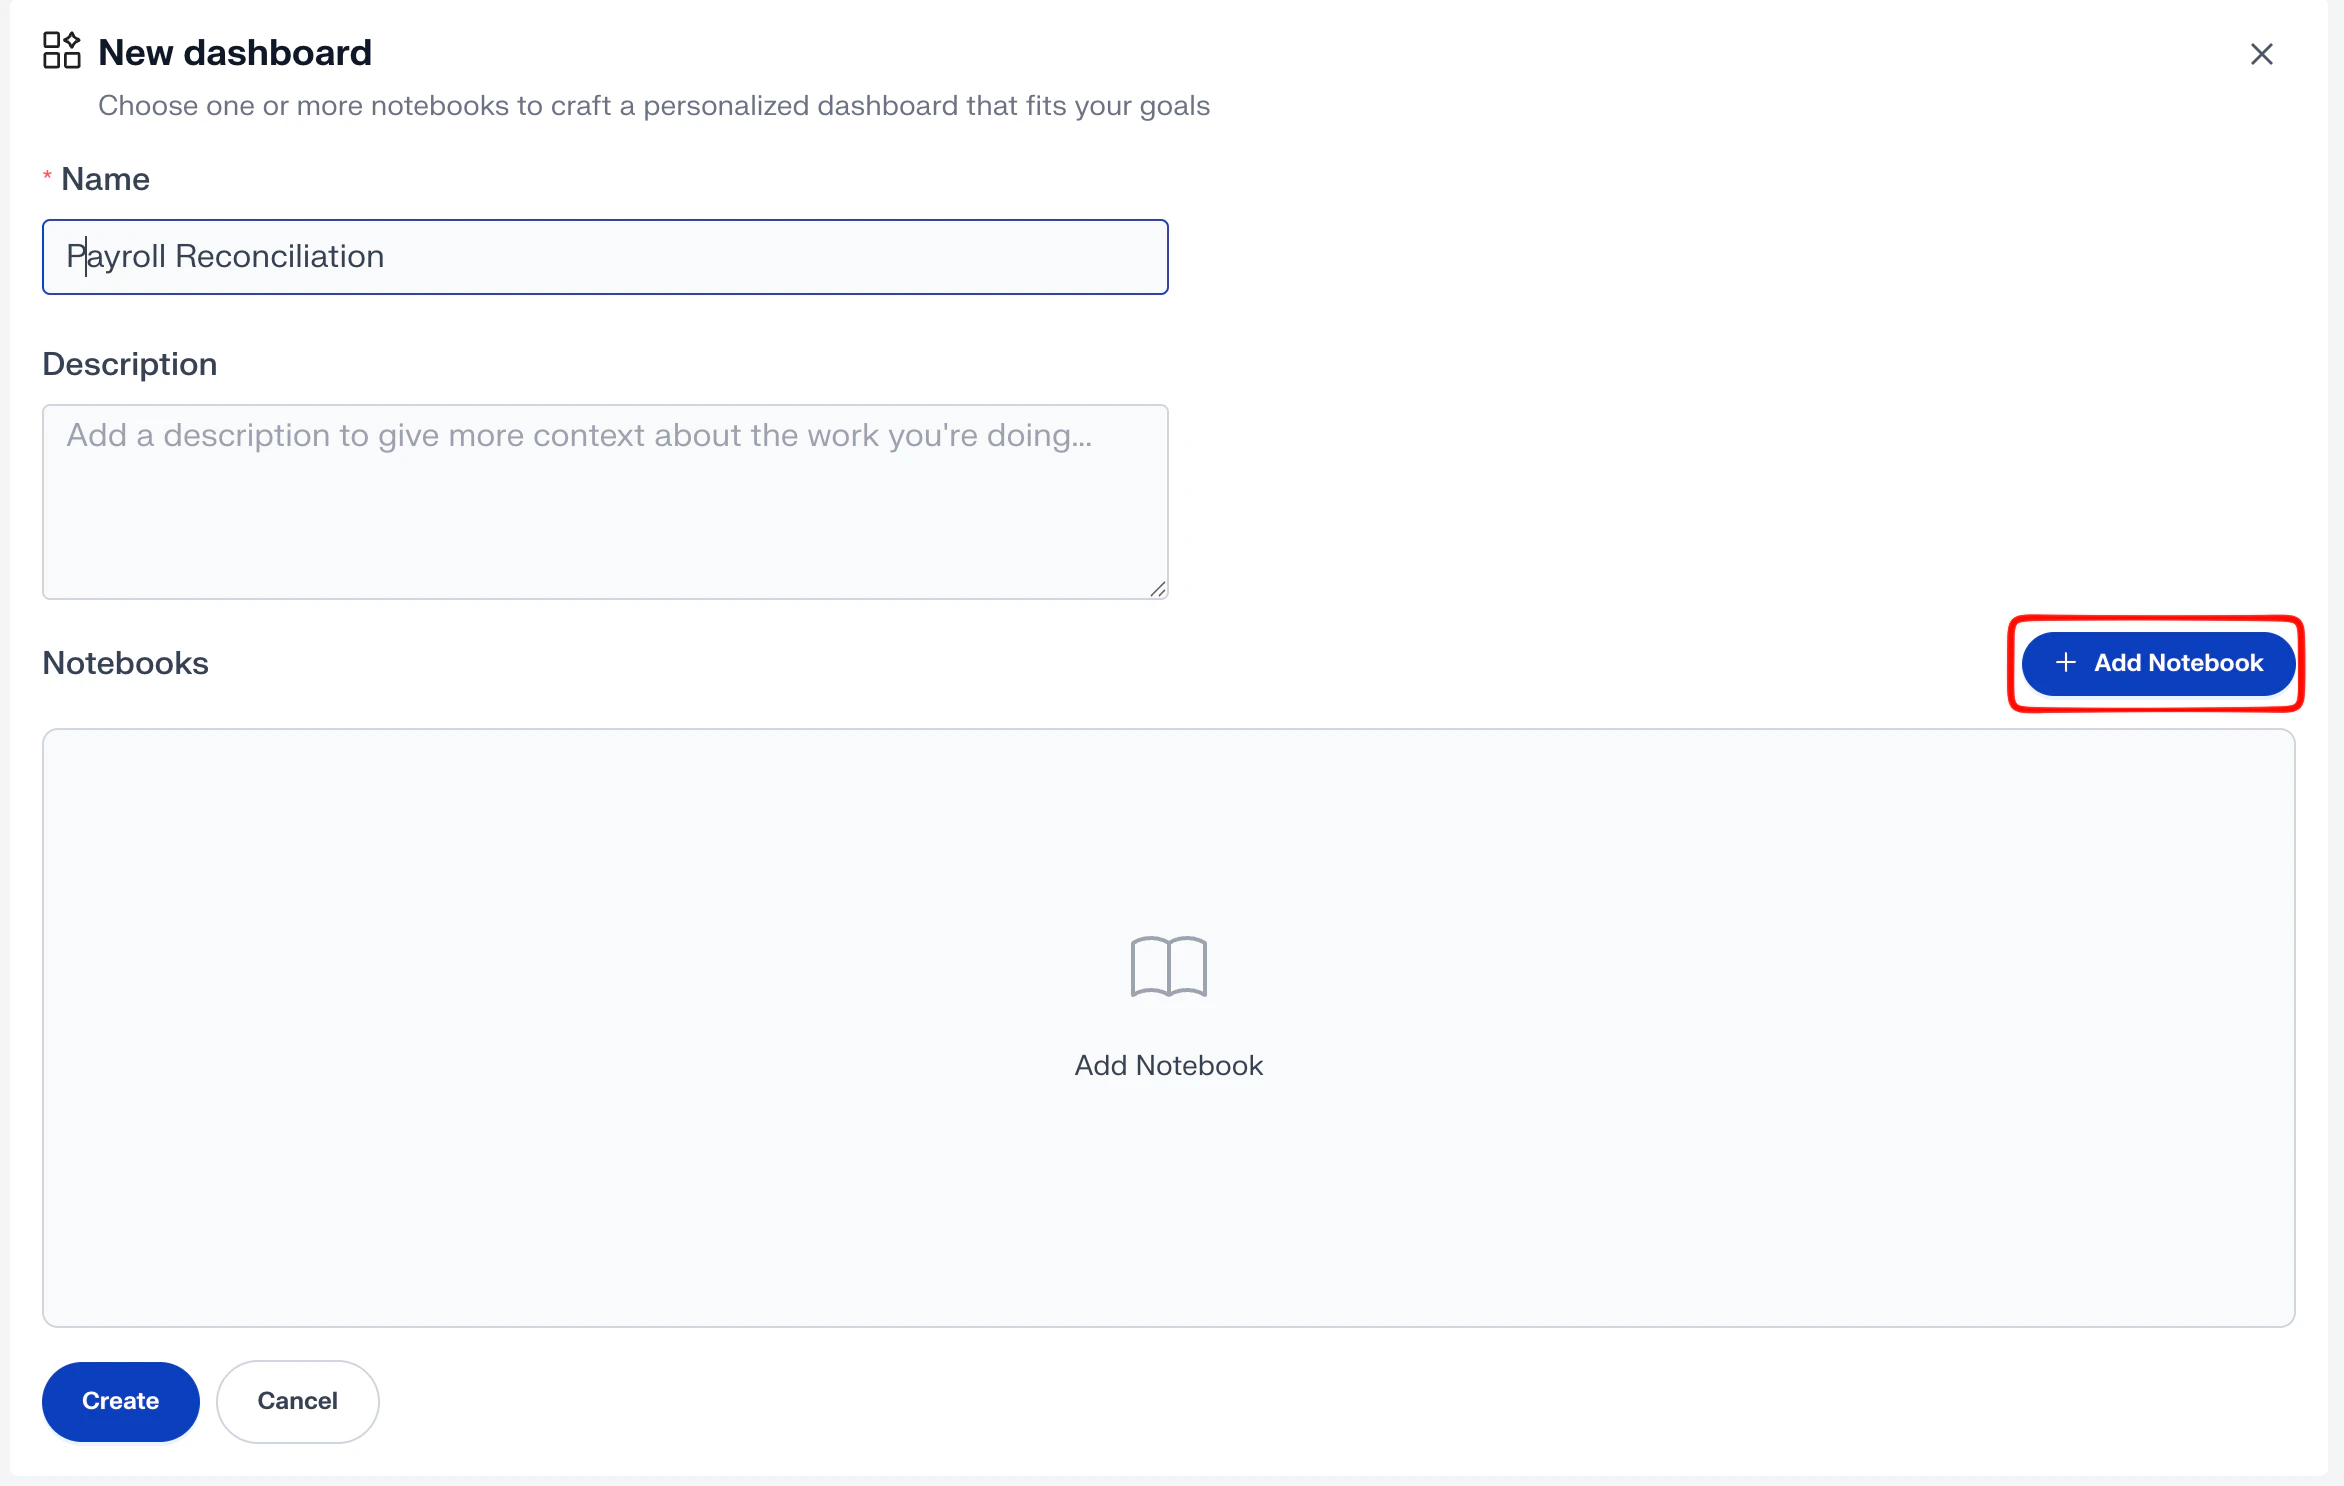
Add notebooks via tags
Dashboards select notebooks by the tags those notebooks carry. To add notebooks: 1. Click + Add Notebooks. 2. Type the tag name you want to group on matching tags appear as you type. 3. Select the relevant tags, the notebooks carrying those tags populate below. 4. Check the notebooks you want to include, then click Add Selected.
Create the Dashboard
Review your selection, then click Create. Your Dashboard is ready. The tags you used appear on the left panel so you can jump between groups of notebooks at any time.Work with Dashboards
Once a Dashboard exists, you can keep using it as a living hub for the team. The sections below cover the most common day-to-day actions.Browse and search
Open the Dashboards page from the left sidebar to see every Dashboard you own and every Dashboard that’s been shared with you. Use the search field at the top to filter by name, then click a result to open it.See combined findings for a tag
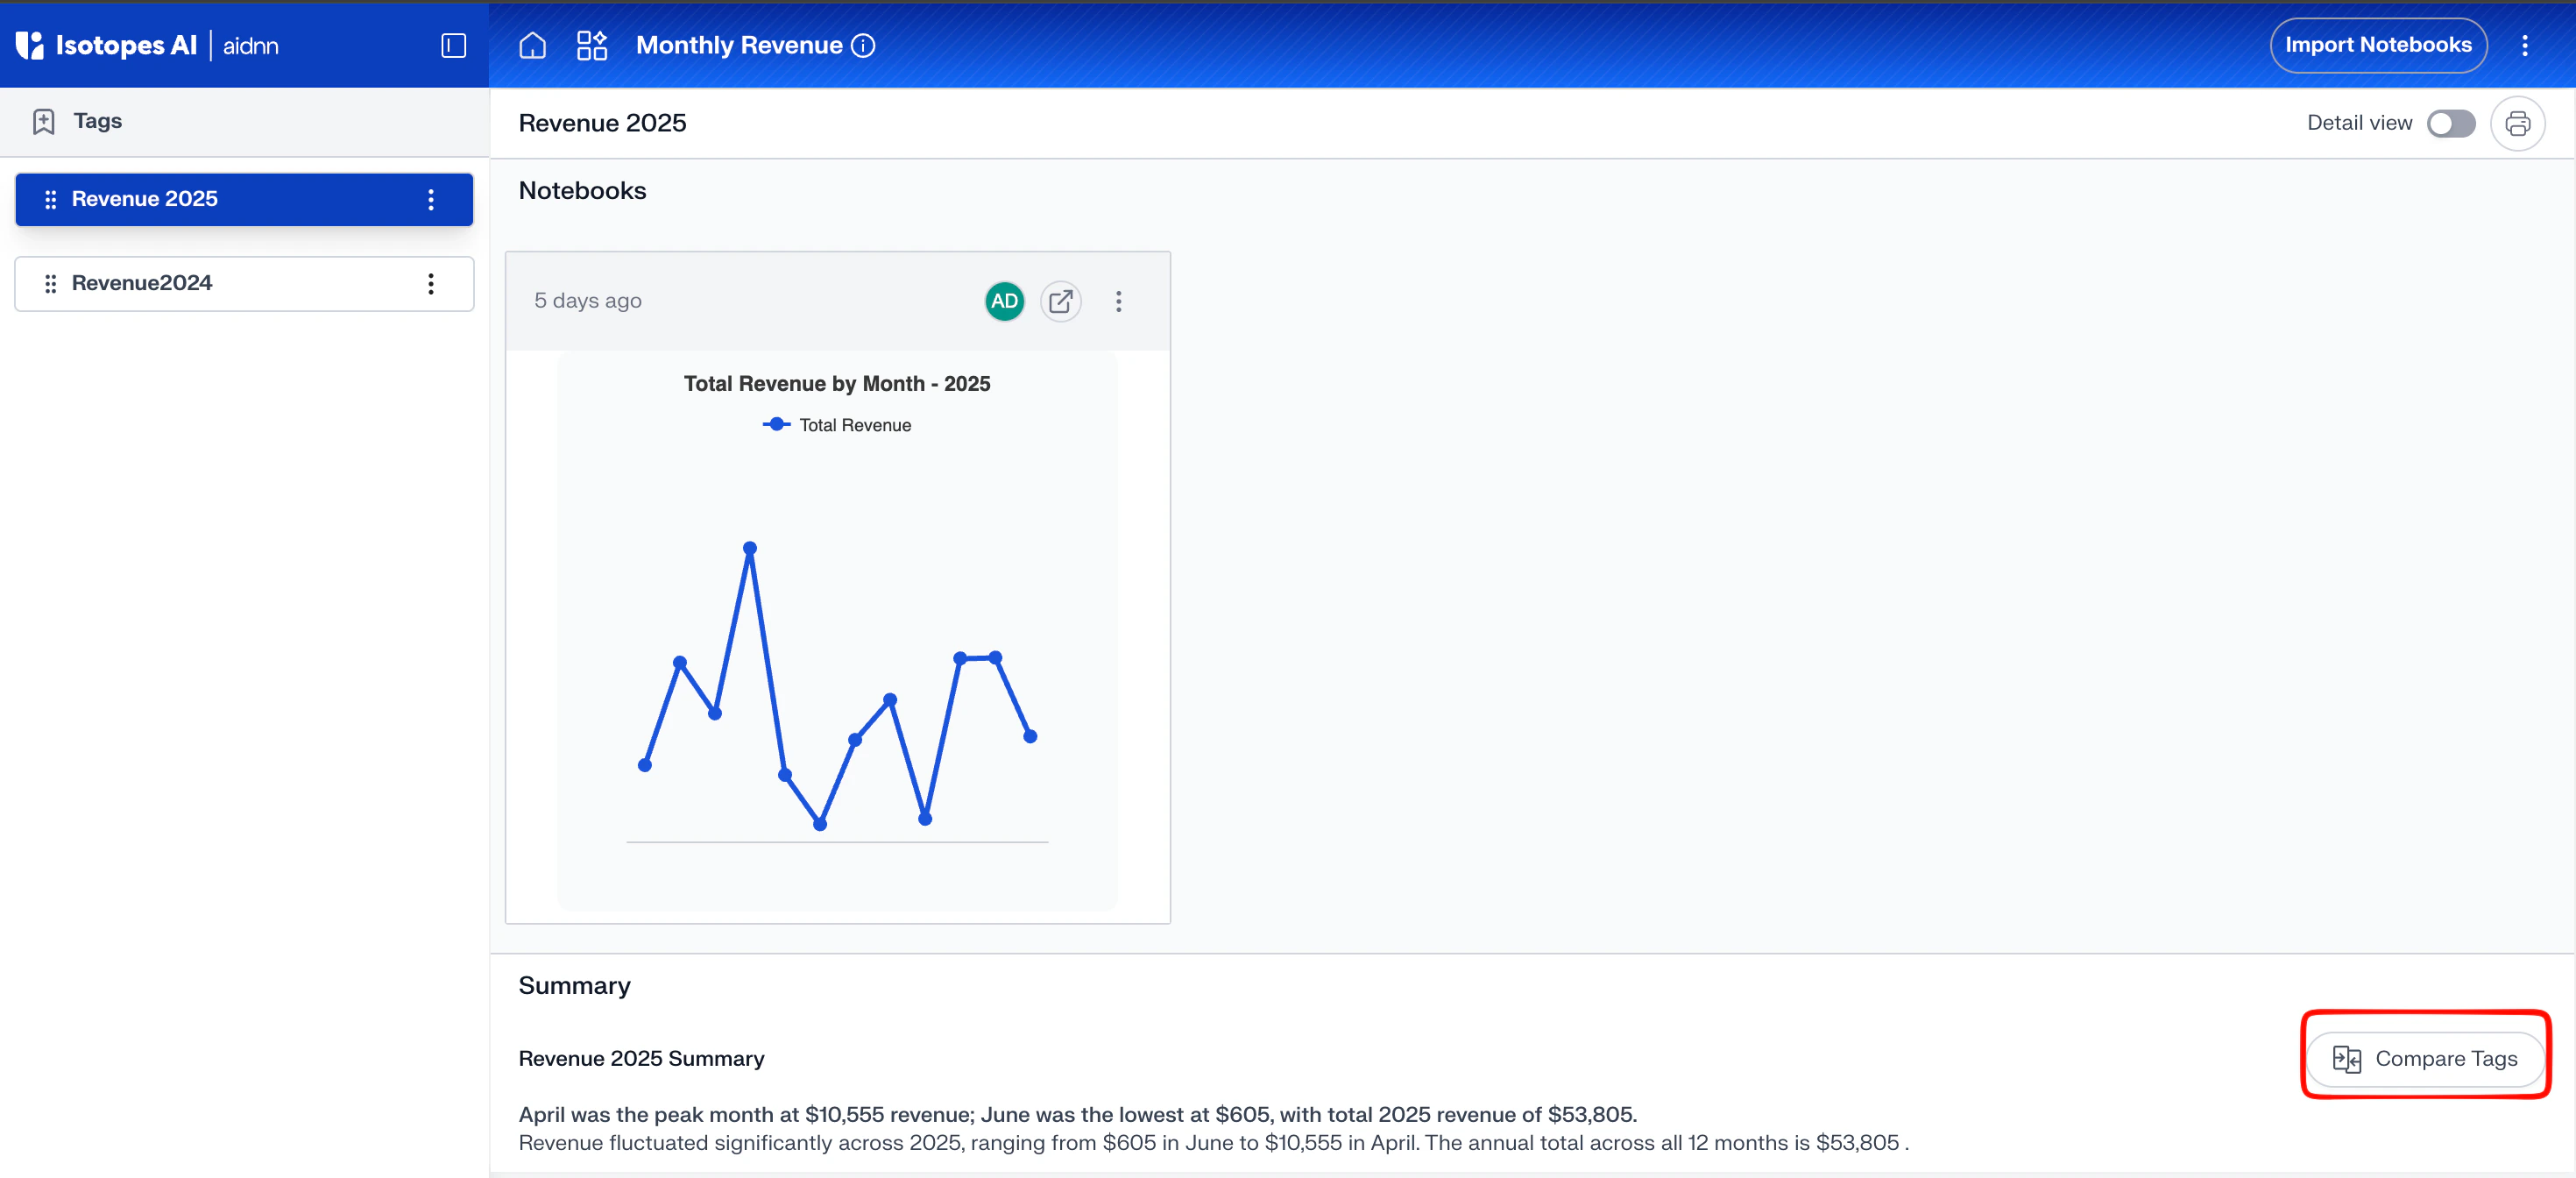
Inside a Dashboard, the left panel shows every tag attached to it. Click a tag to see all notebooks carrying that tag. A Summary appears at the bottom, stitching the findings from each notebook into a single narrative — useful when you need one story across a set of related analyses.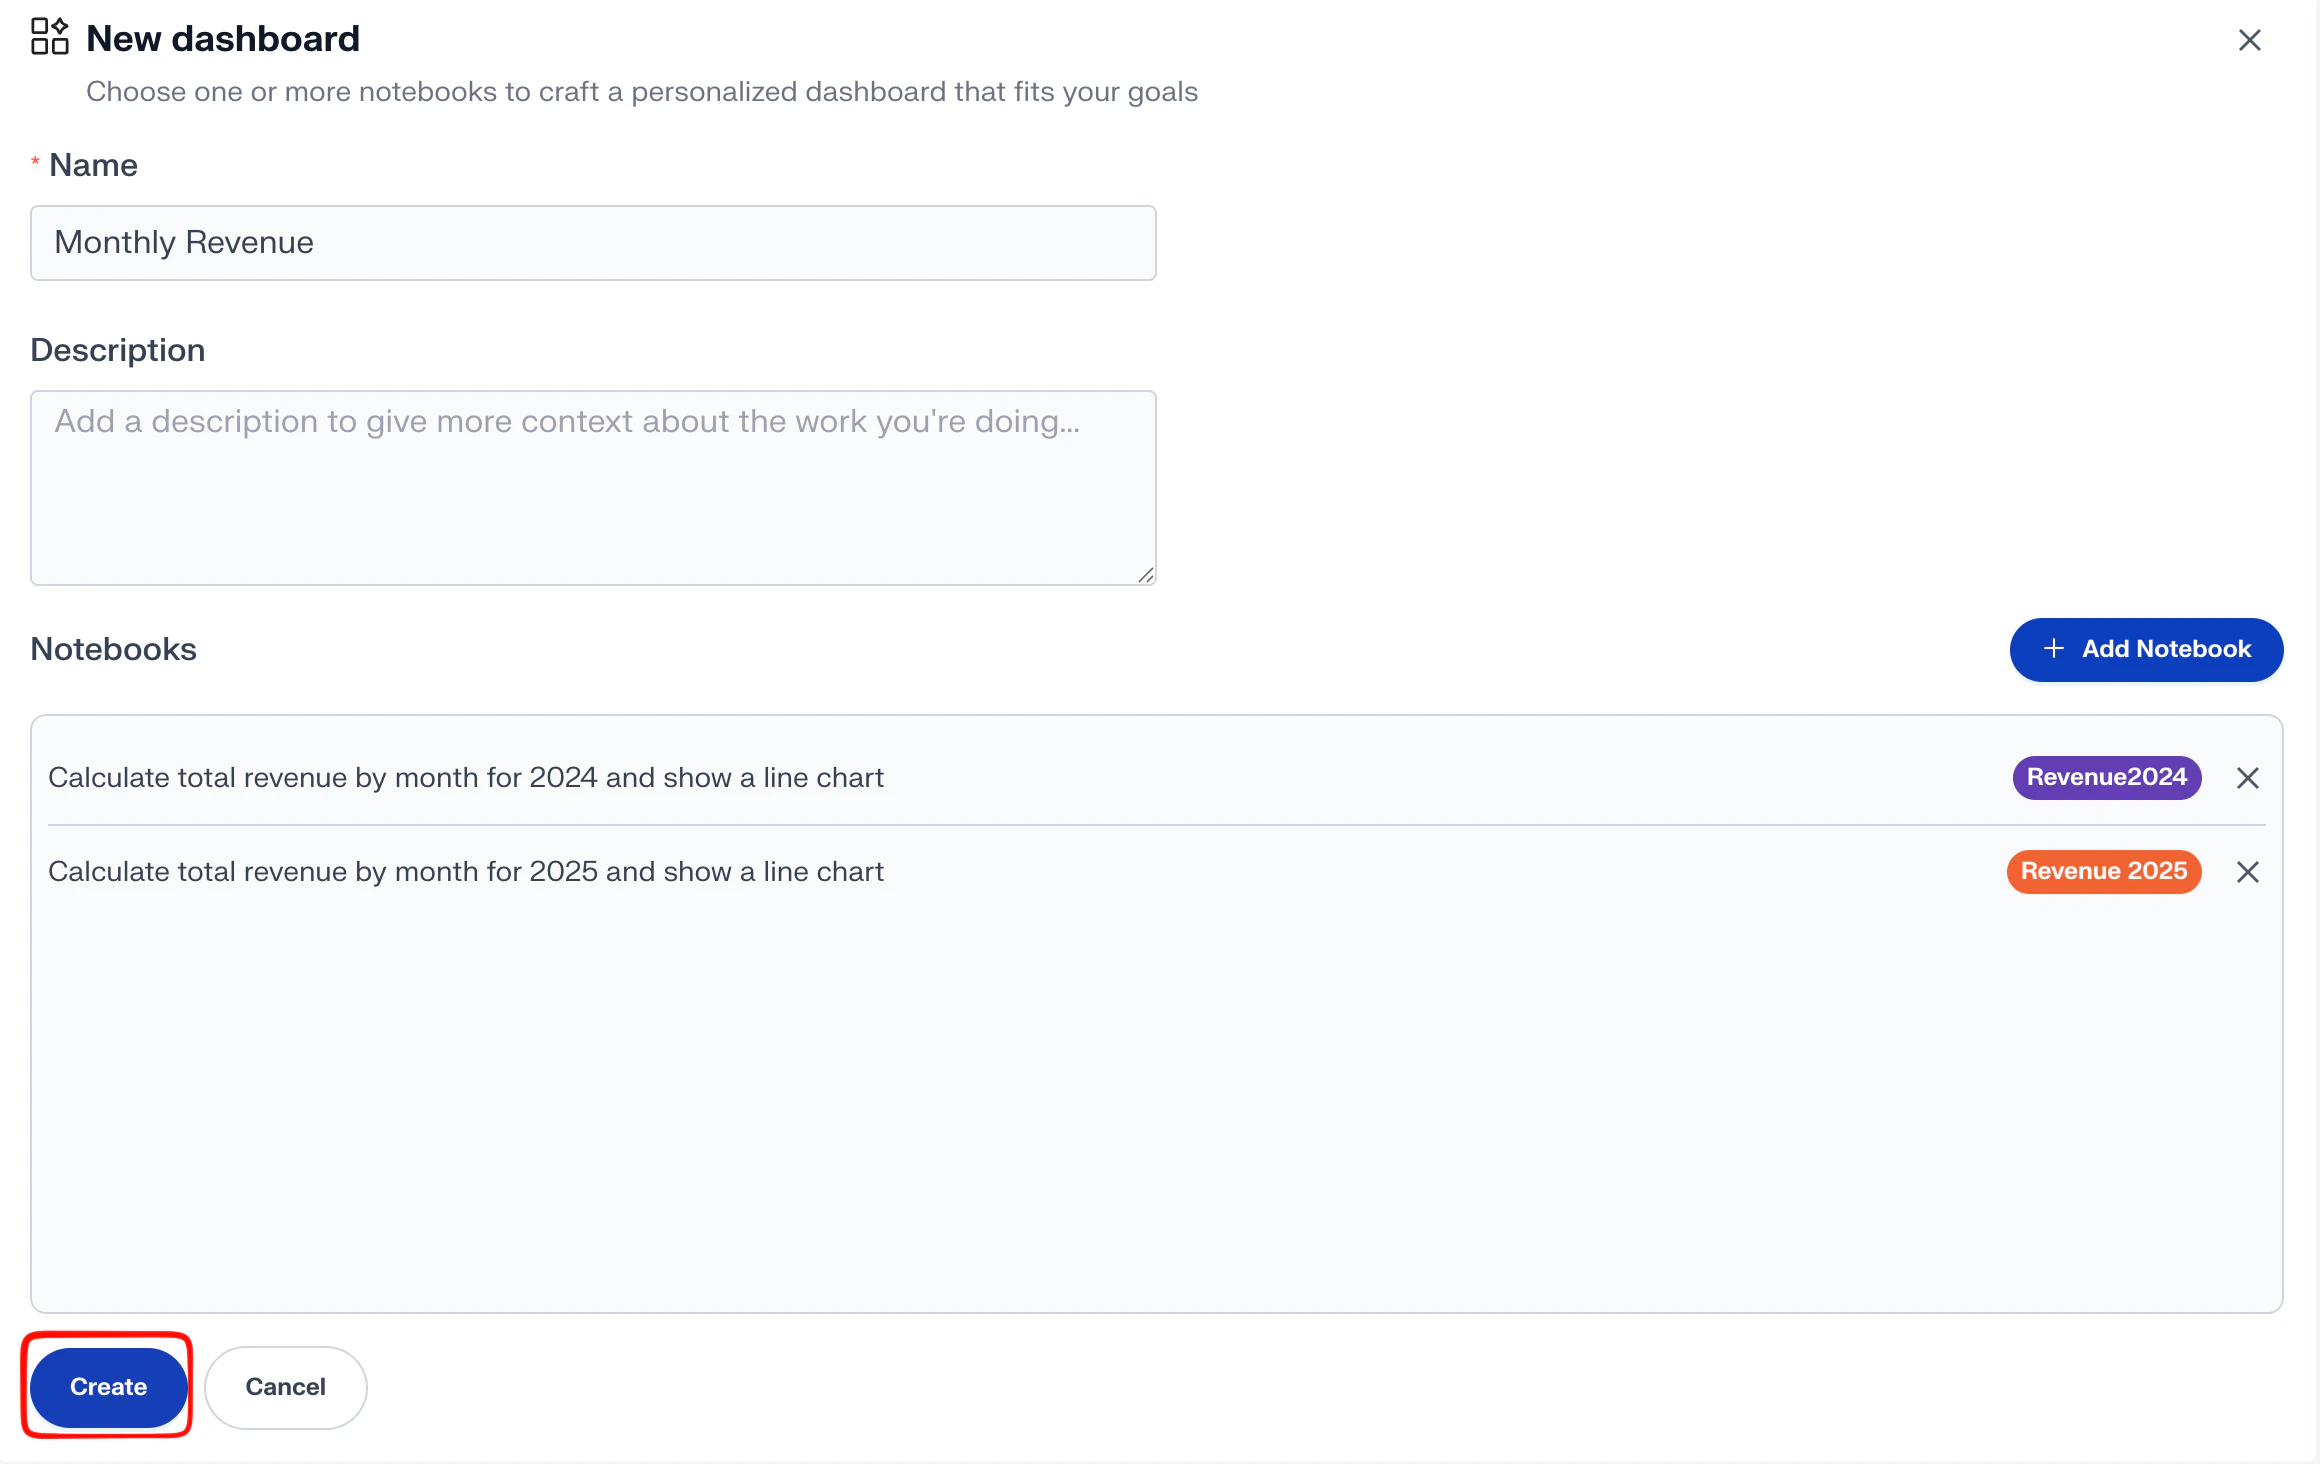
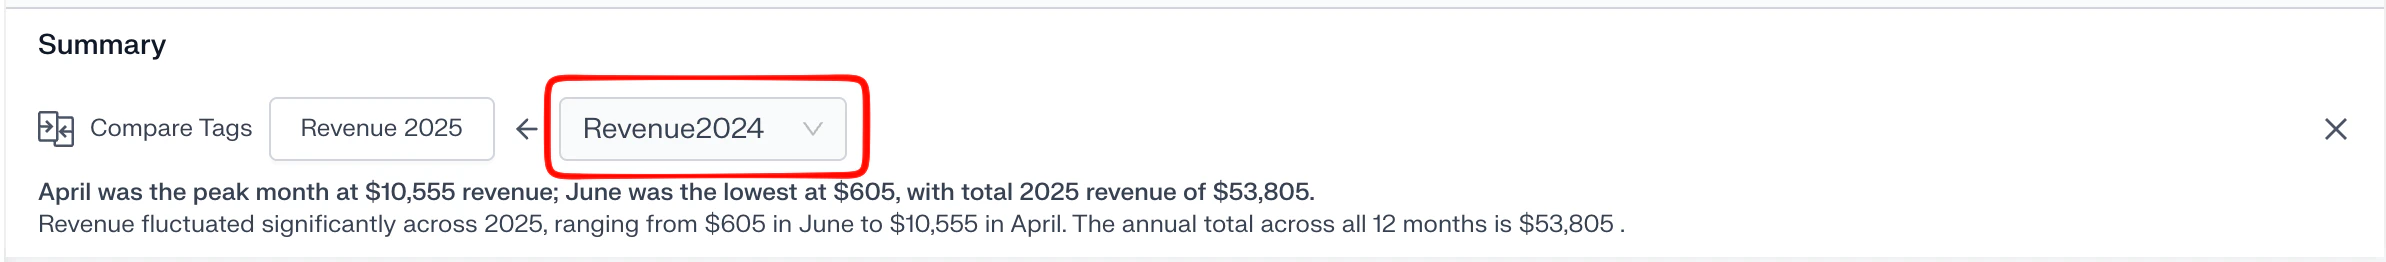
Compare notebooks across two tags
To compare results between two groups (for example, this month vs. last month), click Compare Tags at the top of the Dashboard.