Sales Analysis
aidnn turns sales analysis from a slow, manual exercise into a conversation. Upload your sales data (or connect a system like QuickBooks or NetSuite) ask questions in plain English and aidnn handles the joins, aggregations, comparisons and visualizations. This guide shows you the prompts that work well, walks through a real monthly-review example and ends with a few advanced patterns.Common sales questions
aidnn can help you answer questions like:- What are my total sales for this period?
- Which products are top performers?
- How do sales compare to last year?
- What are the monthly or quarterly trends?
- Which regions or customers drive the most revenue?
- Are there seasonal patterns I should know about?
Example workflow
A typical sales analysis runs through seven stages. Use these prompt patterns as a starting point and adjust the specifics to your data.Step 1 : Load your sales data
Upload a file- “Upload sales_2024.csv”
- “Access sales data from my QuickBooks”
Step 2 : Understand your data
Get a summary- “Show me a summary of the sales data”
- “What’s the date range of this data?”
- “What columns are in this dataset?”
Step 3 : Calculate total sales
Simple total- “Calculate total revenue”
- “Calculate total sales by month”
- “Show me quarterly revenue totals”
- “Calculate total sales by product category”
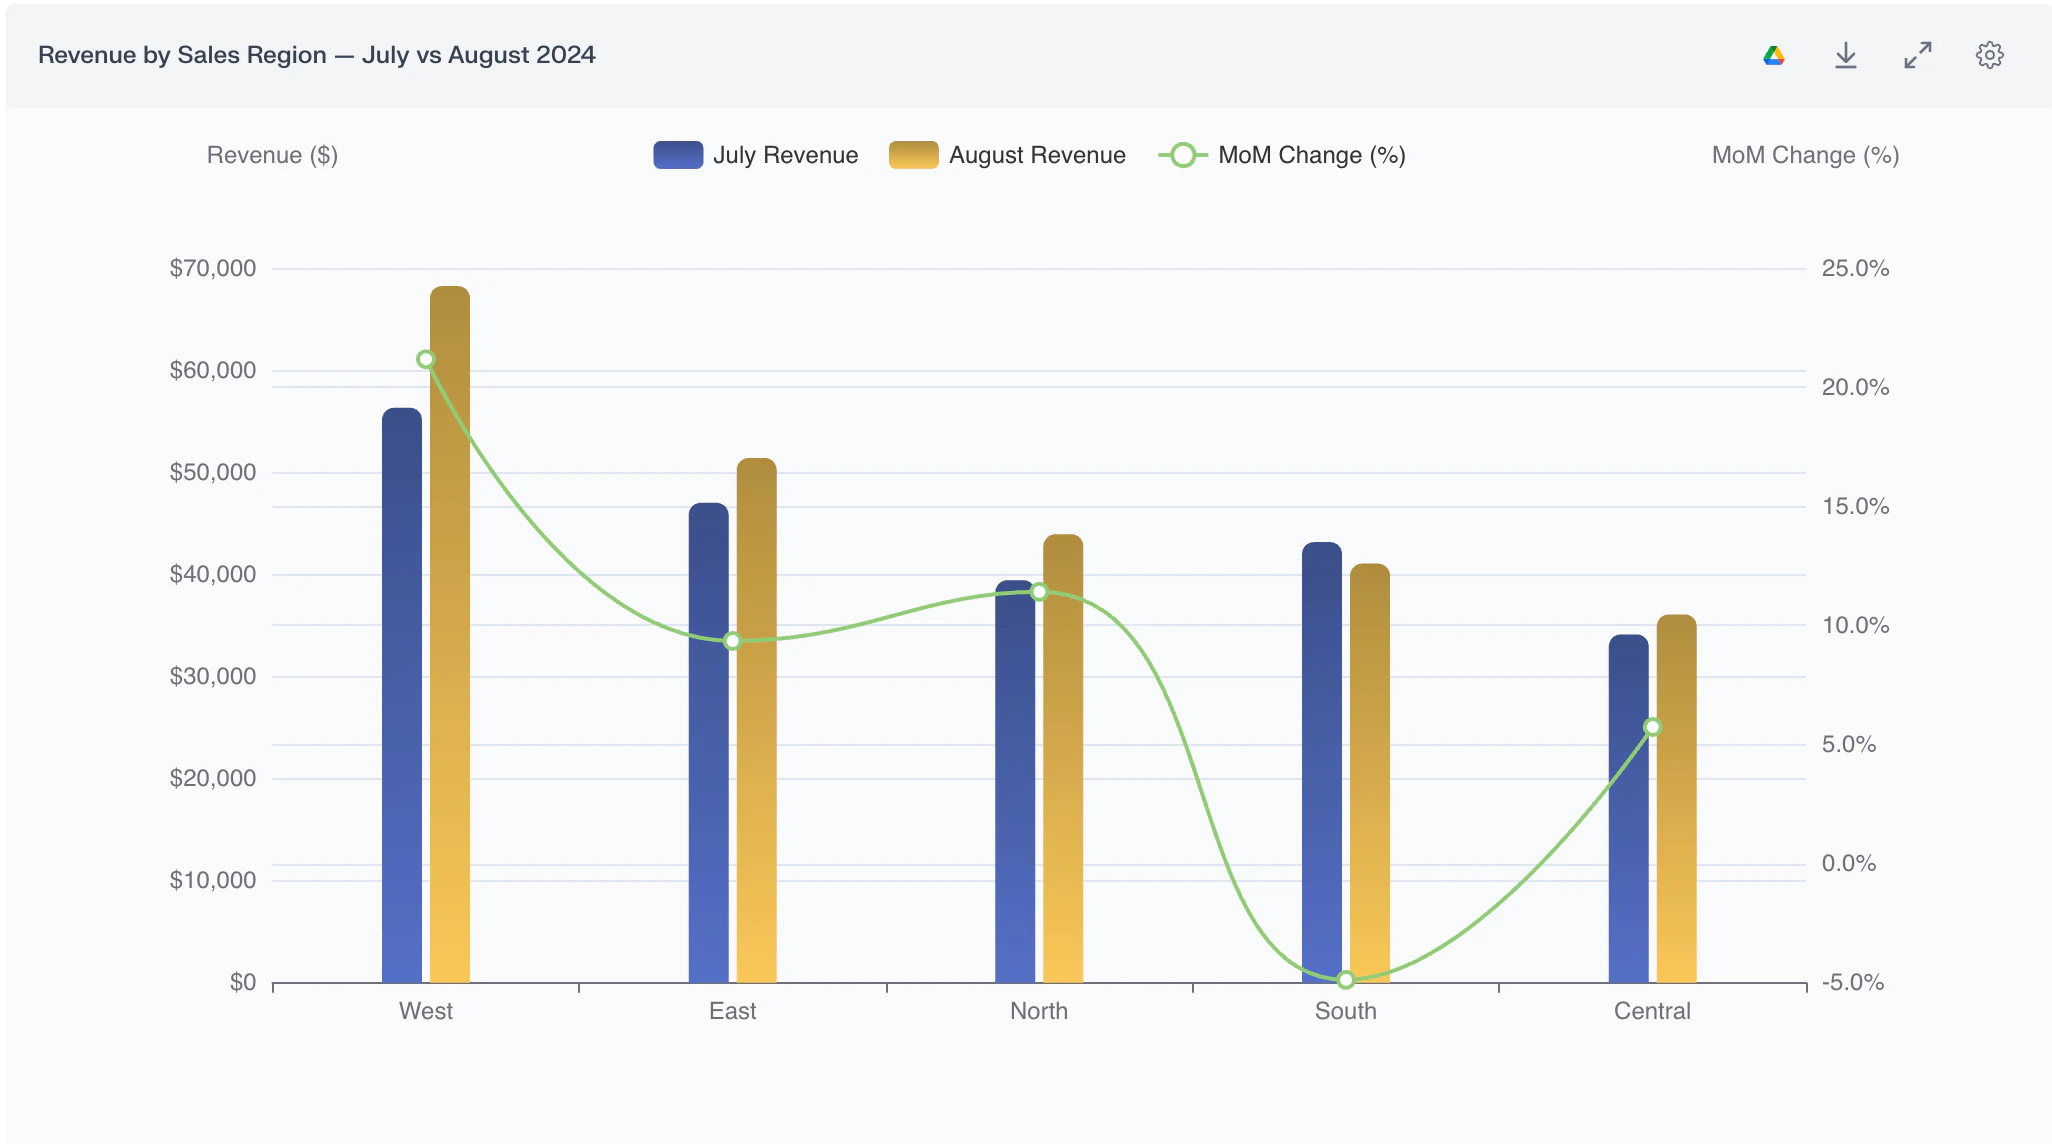
- “Show me revenue by sales region”
Step 4 : Identify top performers
Top products- “Which 10 products generated the most revenue?”
- “Show me my top 20 customers by total sales”
- “Rank regions by revenue”
Step 5 : Analyze trends
Over time- “Create a line chart of monthly sales”
- “Show me the sales trend for the past 12 months”
- “Calculate month-over-month sales growth”
- “What’s the year-over-year growth rate?”
Step 6 : Compare periods
Year comparisons- “Compare 2024 sales to 2023”
- “Show me side-by-side revenue for this year and last year by month”
- “Compare Q1 and Q2 revenue”
- “Compare sales before and after our price increase in July”
Step 7 : Segment analysis
By product- “Break down sales by product category”
- “Show me the percentage of revenue from each product line”
- “Segment customers by purchase frequency”
- “Show me revenue from new vs returning customers”
- “Create a breakdown of sales by state or region”
Real-world example: monthly sales review
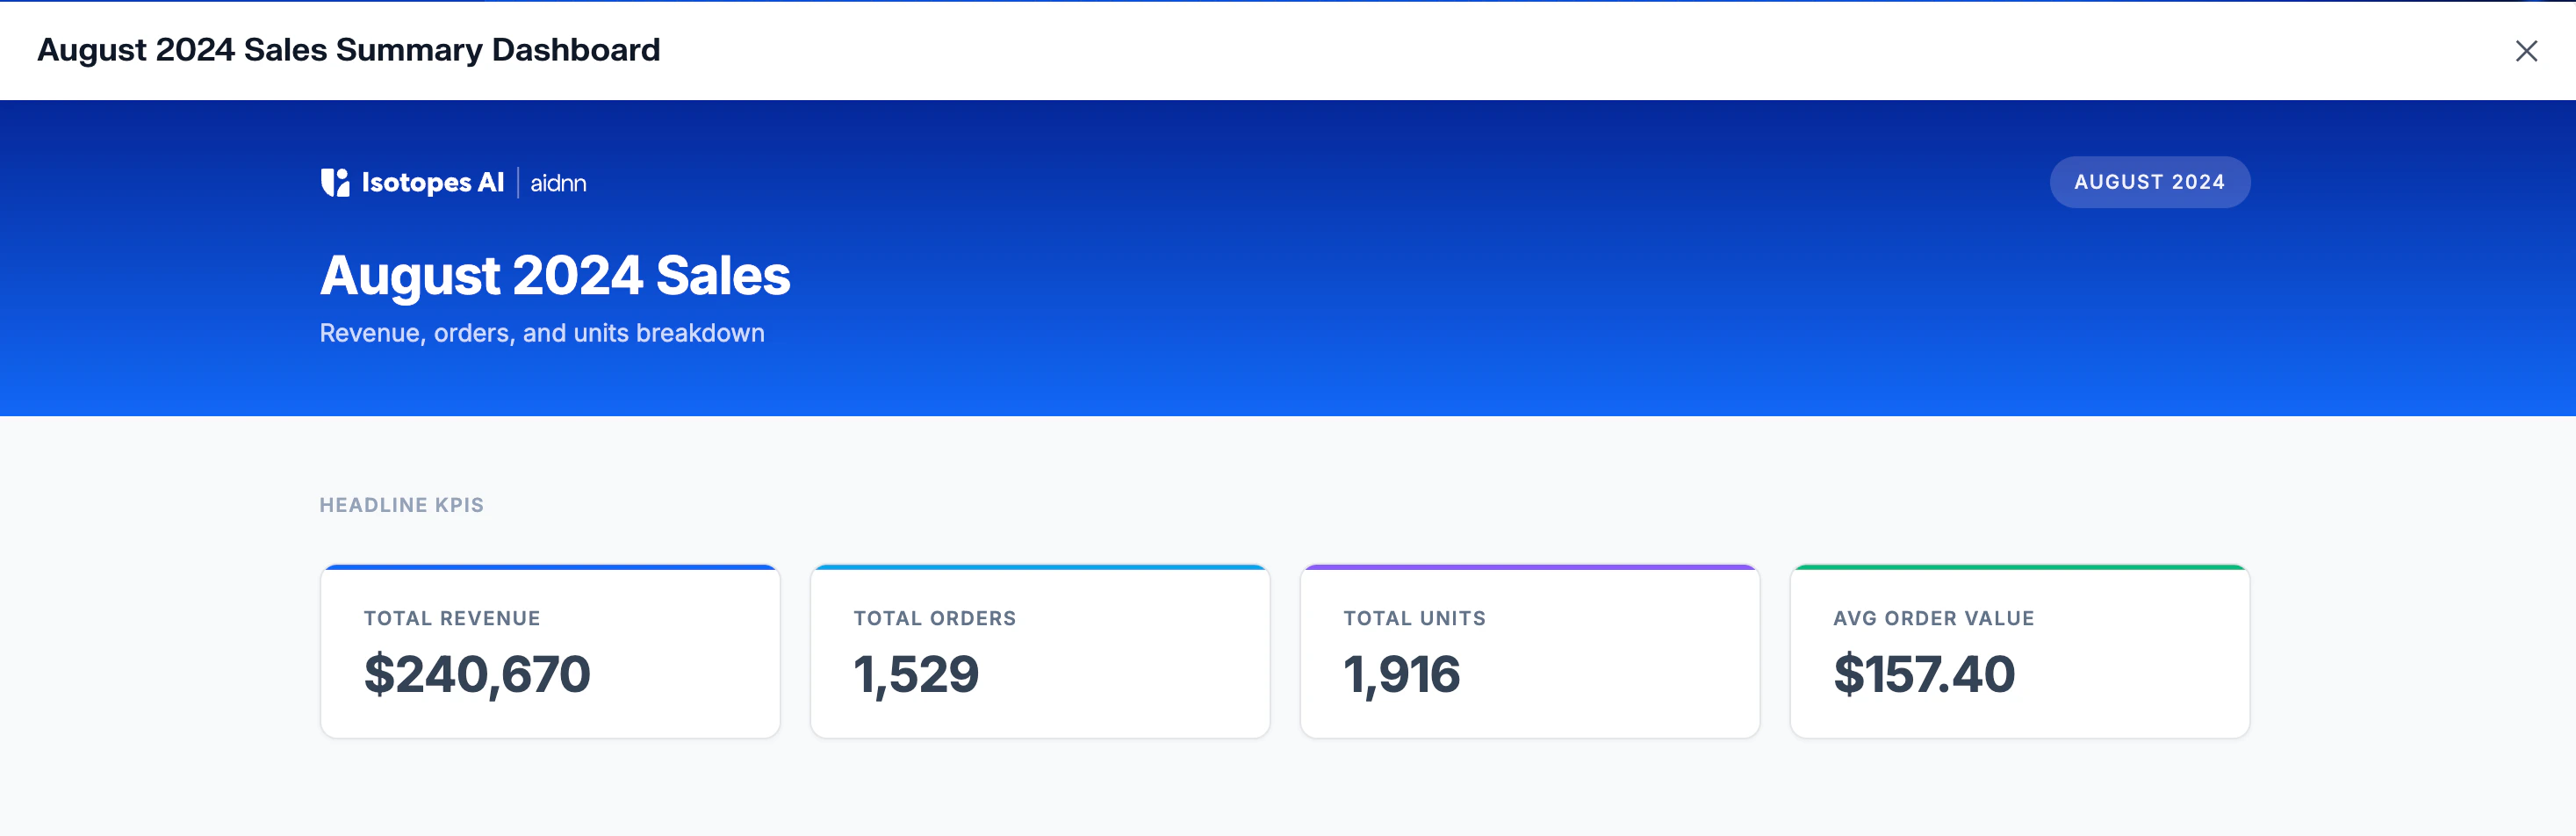
Business context - You’re a sales manager preparing for your monthly review. You need to understand last month’s performance and call out areas of concern or opportunity. Here’s the conversation, end to end. Each numbered item is what you say to aidnn followed by what aidnn returns. 1. Load the data “Upload august_2024_sales.csv”aidnn confirms: 1,529 transactions loaded. 2. Get an overview “Show me a summary of August sales”
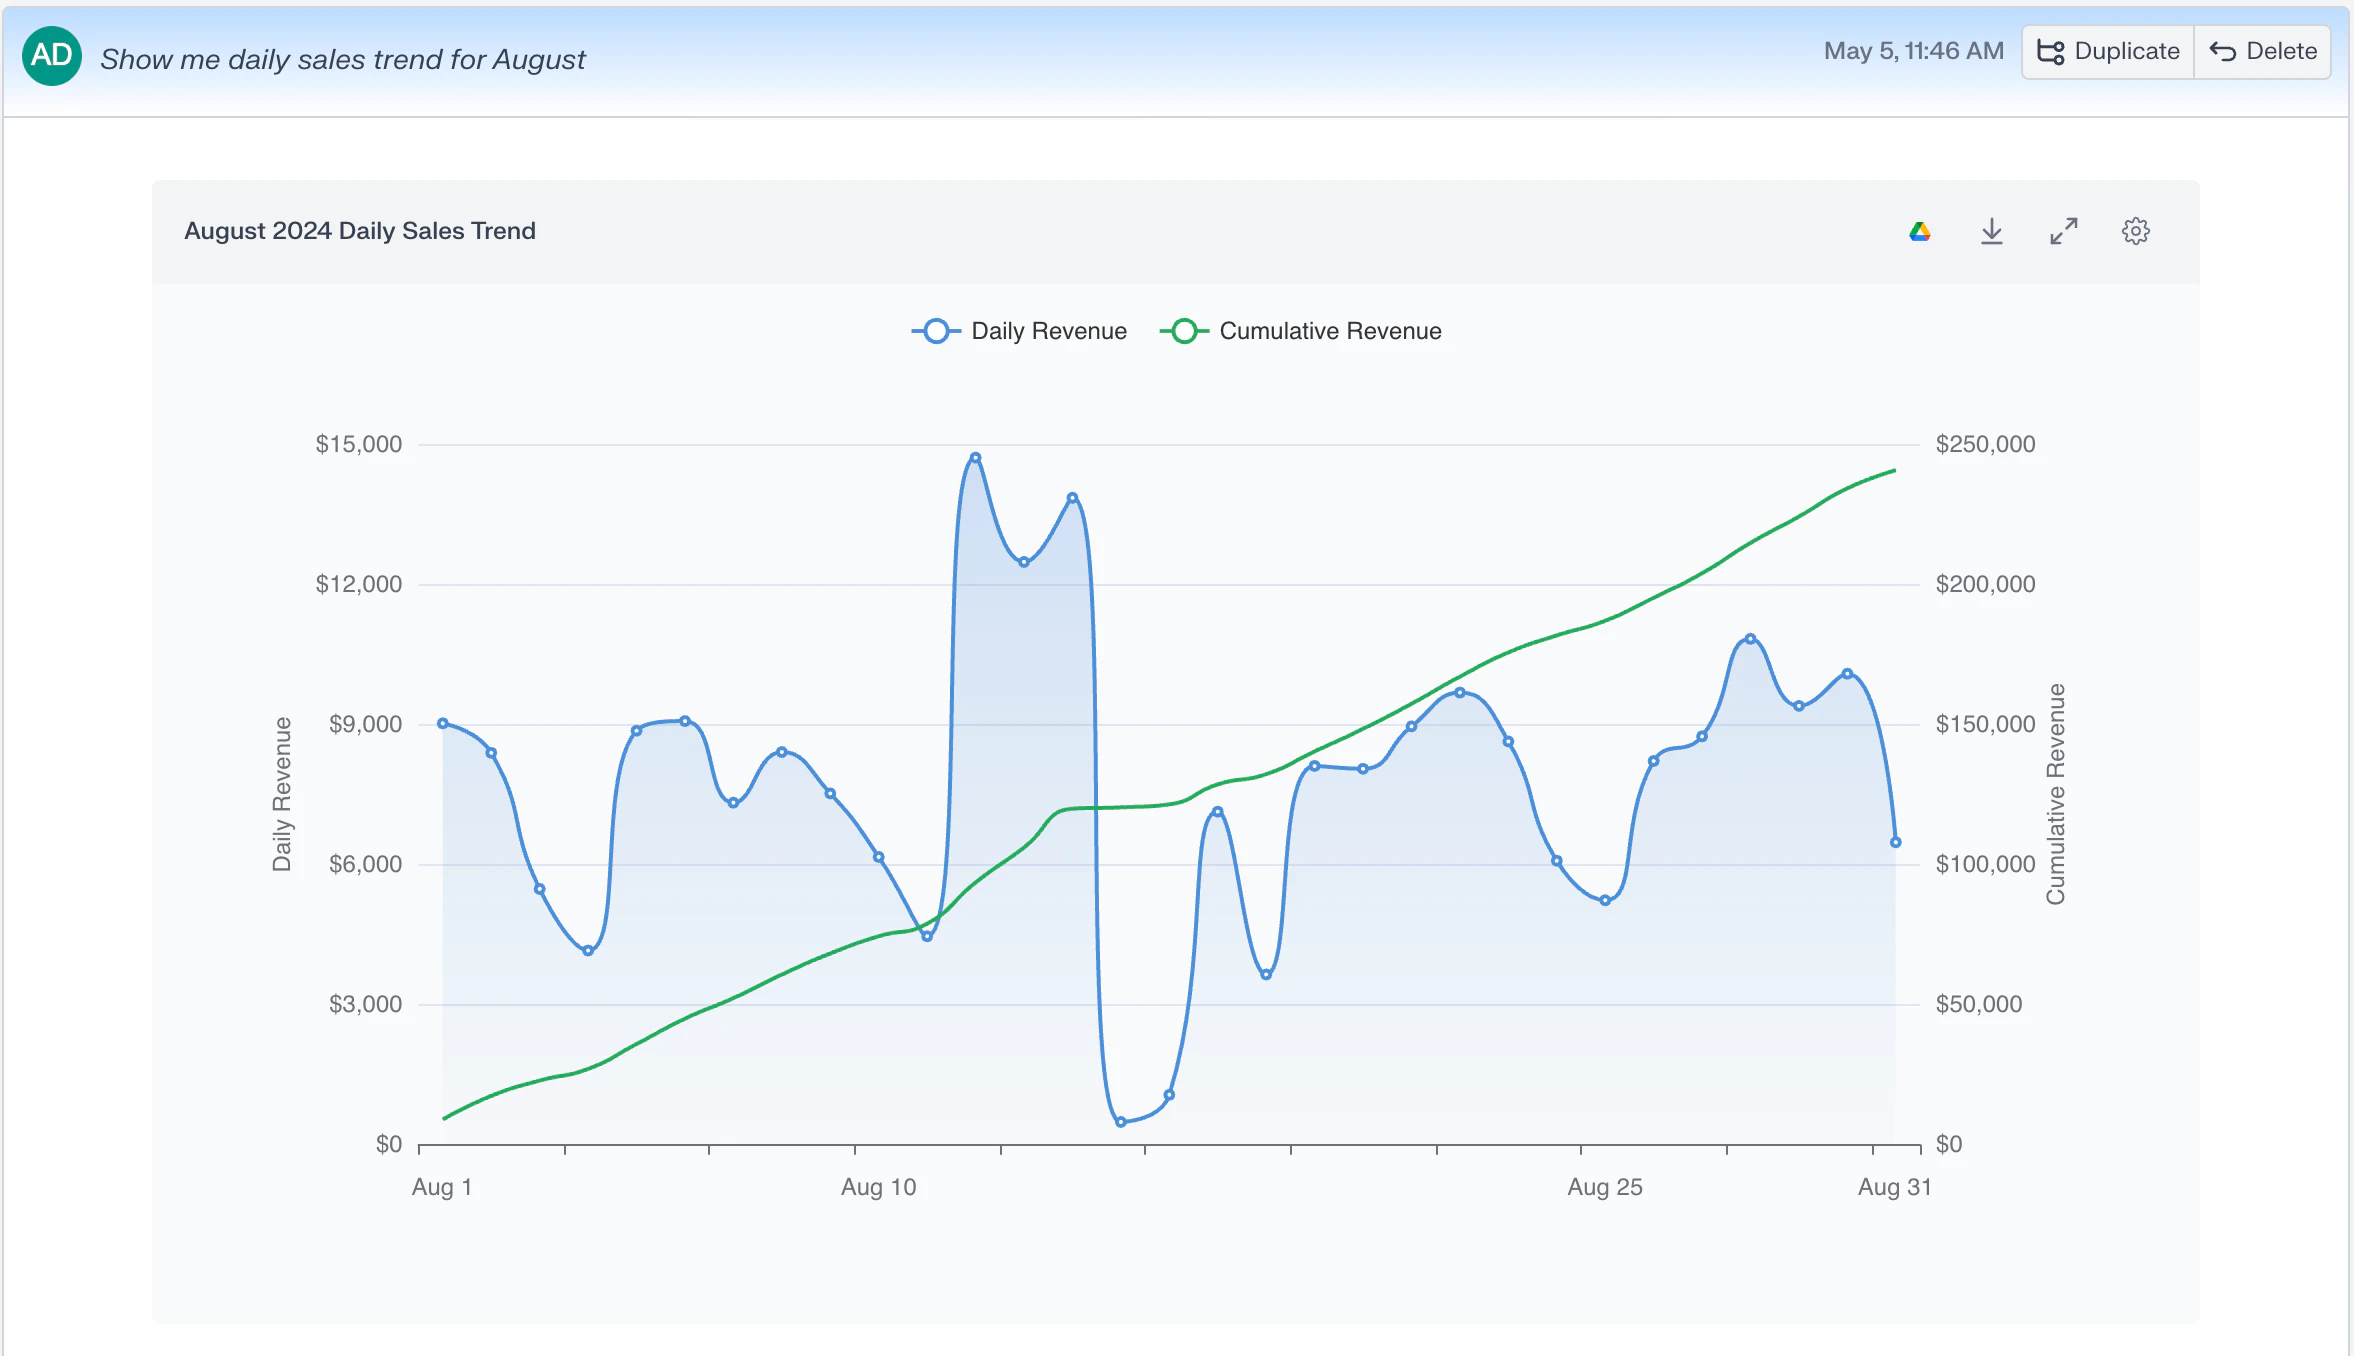
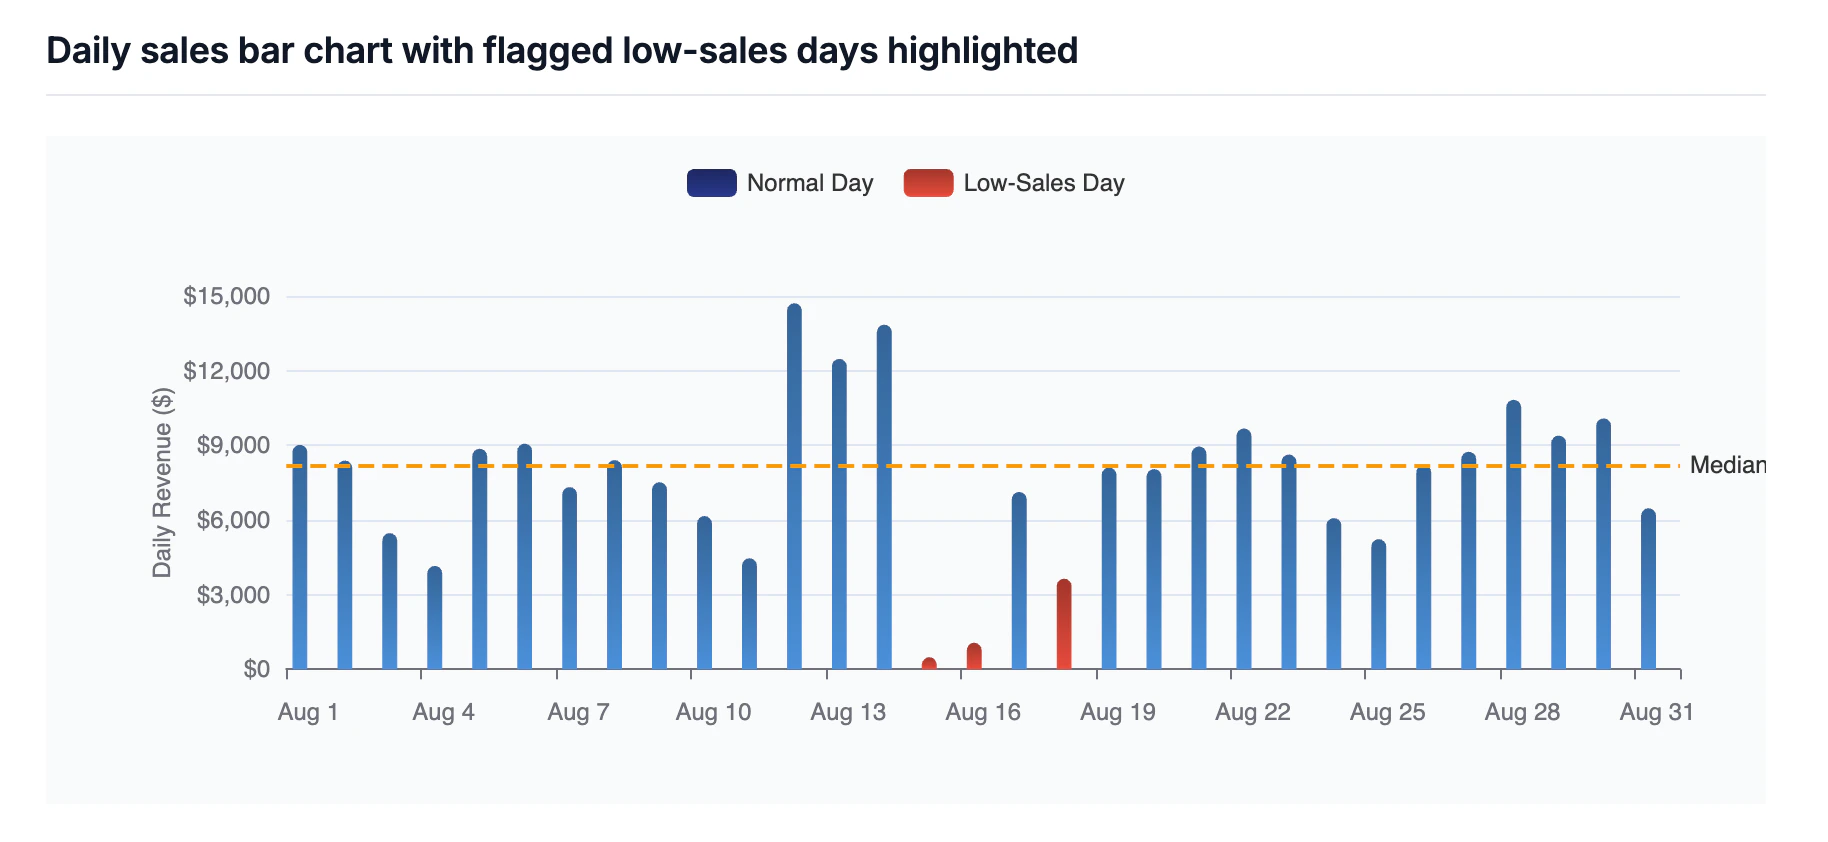
All 31 days recorded sales activity. The trend shows notable day-to-day variability with a low of $487 on the weakest day. Cumulative revenue crossed $120K around mid-month, reflecting a fairly steady pace throughout August. 6. Investigate concerns “Were there any days with unusually low sales?”

Tips for sales analysis
Be specific with time periods
Good:- ✓ “Show me sales for Q4 2023”
- ✓ “Compare October to September”
- ✓ “Last 90 days of sales”
- ✗ “Show me recent sales”
- ✗ “What about last quarter?”
Think in segments
Don’t just look at totals. Slice your data by:- Product categories
- Customer segments
- Geographic regions
- Sales channels
- Time periods
Look for patterns
Ask aidnn to surface:- Trends - up, down or flat over time.
- Seasonality - monthly or quarterly cycles.
- Anomalies - unusual spikes or dips worth investigating.
- Correlations - what moves together (and what doesn’t).
Compare and contrast
Always provide context, a number on its own rarely tells a story:- This year vs last year
- This month vs last month
- Actual vs target
- Region A vs Region B
Advanced sales analysis
Customer lifetime value
- “Calculate lifetime value for each customer”
- “Show me CLV by customer acquisition cohort”
Sales forecasting
- “Based on the past 12 months, forecast next quarter”
- “If this trend continues, what will December sales be?”
Product mix analysis
- “What percentage of sales come from each product category?”
- “How has our product mix changed over time?”
Sales rep performance
- “Compare sales by sales representative”
- “Who are the top performers this quarter?”
Price analysis
- “What’s the relationship between price and quantity sold?”
- “Show me how sales changed after our price adjustment”
Next steps
- Capture an organization-level memory in NeoCortex with your sales definitions (for example “Revenue is recognized monthly at the date of invoice, not order date”) so every future sales analysis applies the same rule.
- Tag this notebook so it shows up on a “Monthly sales review” Dashboard alongside your other recurring sales analyses.
- Connect QuickBooks, NetSuite, or your data warehouse via the Connectors page so you don’t need to re-upload a CSV every month.